Appendix B. Tools for debugging Ajax applications
This appendix gives you a tour of some of the tools most frequently used by Ajax developers. It explains how to install web tools like Firebug and Web Development Helper and provides an overview of their main features. A section is also dedicated to Fiddler, a tool for debugging HTTP traffic. Finally, the last section explains how to debug script files using the Visual Studio debugger and the Script Explorer window.
Firebug is a web tool shipped as an add-on to the Firefox browser. It can monitor HTTP traffic, inspect the DOM of a page, and debug JavaScript code. When run in the browser, Firebug lets you change the look and behavior of a web page in real time.
You can install Firebug from the official website at http://www.getfirebug.com, which also contains an online guide to the features provided by this web tool. Figure B.1 shows the Firebug homepage. Let’s examine the installation procedure for Firebug before diving into a tour of its features.

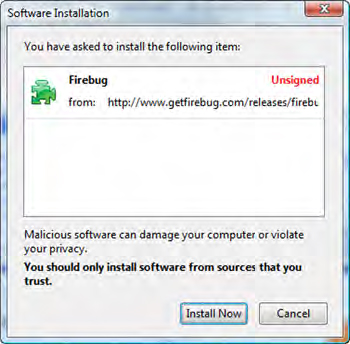
Installing Firebug is straightforward. On the homepage, click the Install icon located at upper right. Firefox prompts you for the permissions to perform the installation and then restarts the browser, as shown in figure B.2.