appendix-a
appendix A The math behind the adjustment formula
In chapter 2, we introduced the adjustment formula from an intuitive point of view. If you’re interested in a deeper dive into how this formula is formally developed using math, this section is for you. We’ll clearly outline our assumptions, explain graphs using mathematical expressions, and work through some algebraic manipulations.
The main objective is the following. Assume we have data generated from figure A.1, which creates a probability distribution P:
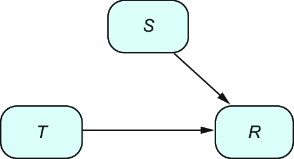
- The intervened graph, figure A.2, shows how we would like the data generated, which would create a probability distribution P|do(T = A). For this proof, to improve the notation, we will use Pdo(T=A) to denote P|do(T = A).
- So, we want to calculate a quantity on the intervened graph: the recovery rate Pdo(T = A), but only using terms from the original graph with distribution P (it is the only information we have access to).
Figure A.1 Historical data generation process
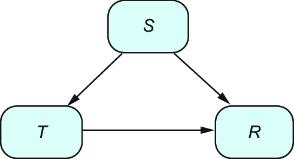
Figure A.2 How we would like the data to be generated
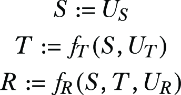
Each graph can be translated equivalently into a set of equations. Let’s start with distribution P: