5 Finding comparable cases with propensity scores
This chapter covers
- Using propensity scores to assess the positivity assumption
- Calculating the ATE using propensity-score techniques
You are here
Figure 5.1 Applying the adjustment formula
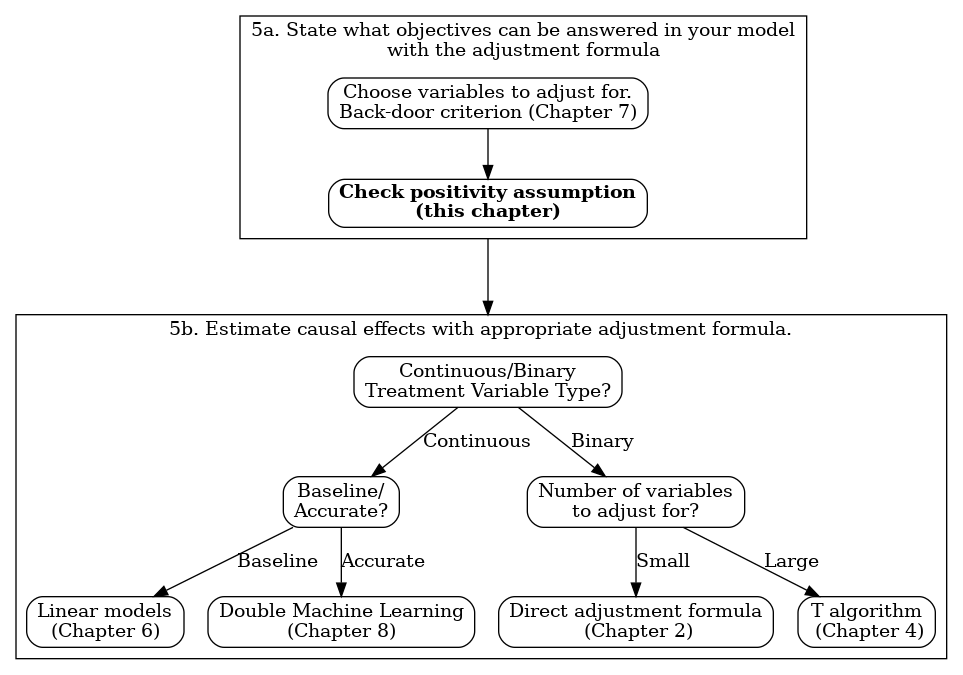
Let’s revisit the main point: how to choose between two options when we can’t use randomized controlled trials or A/B tests. Remember the kidney stones example from Chapter 2? We’ve used the adjustment formula to tackle problems like this. Now, there’s a modified version of this formula. Why do we need it? It’s specifically made to see if the positivity assumption is true or not.
Remember from Chapter 2 that the adjustment formula only works if the positivity assumption is true. Let’s go over what this assumption means. Suppose you have two treatments, A and B. You give treatment A to both young and old people, but treatment B only to young people. Now, if you want to figure out the effect of treatment B on everyone, both young and old, you hit a snag. We can’t know how treatment B affects old people unless some of them also receive this treatment. To determine which treatment is better, you need to apply both treatments, A and B, to both age groups: older and younger.