7 Dealing with Complex Graphs
This chapter covers
- A mathematical definition of a causal model
- Deriving conditional independencies between variables with d-separation
- Using the back-door criterion to decide which variables to put in the adjustment formula
you are here
Figure 7.1 Applying the adjustment formula
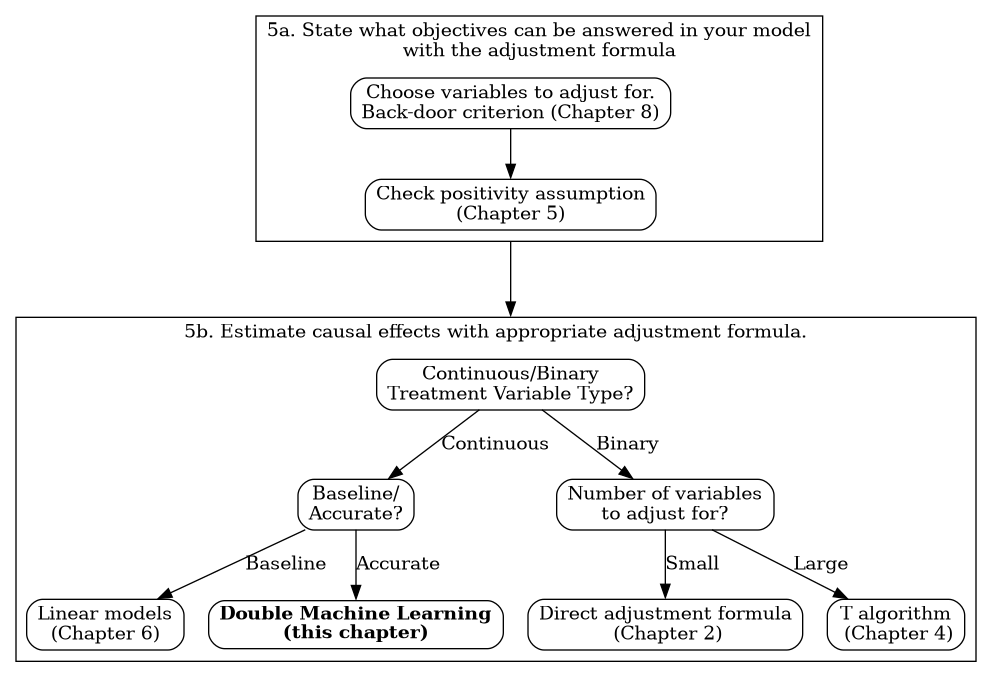
We now know that one way to remove the effect of confounders is by using the adjustment formula. But in real-life DAGs, it is not always clear which variables we need to adjust for. Let’s see an example.
Imagine we work in a company that wants to find the optimal price they can set for a pair of shoes. The company wants to specify several prices, and learn the expected number of sales for each one. In this way, they can calculate the price that maximizes their profit. So, we want to estimate the causal effect of the price on sales. Historically, they have tried different prices, but no A/B tests were performed. This is the same problem we encountered earlier in the book, when we wanted to estimate the causal effect of a medical treatment on the outcome of that treatment on patients' health. Here, price substitutes for treatment, and number of sales is the equivalent of the outcome. If you recall, the first step in estimating the causal effect of a factor on an outcome is to identify the confounders that are playing a role in our problem.