chapter two
Chapter 2. Information visualization data flow
This chapter covers
- Loading data from external files of various formats
- Working with D3 scales
- Formatting data for analysis and display
- Creating graphics with visual attributes based on data attributes
- Animating and changing the appearance of graphics
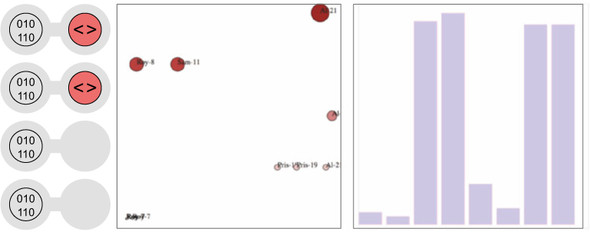
Toy examples and online demos sometimes present data in the format of a JavaScript-defined array, the same way we did in chapter 1. But in the real world, your data is going to come from an API or a database and you’re going to need to load it, format it, and transform it before you start creating web elements based on that data. This chapter describes this process of getting data into a suitable form and touches on the basic structures that you’ll use again and again in D3: loading data from an external source; formatting that data; and creating graphical representations of that data, like you see in figure 2.1.
Figure 2.1. Examples from this chapter, including a diagram of how data-binding works (left) from section 2.3.3, a scatterplot with labels (center) from section 2.3, and the bar chart (right) we’ll build in section 2.2