Chapter 7. Network visualization
This chapter covers
- Creating adjacency matrices and arc diagrams
- Using the force-directed layout
- Using constrained forces
- Representing directionality
- Adding and removing network nodes and edges
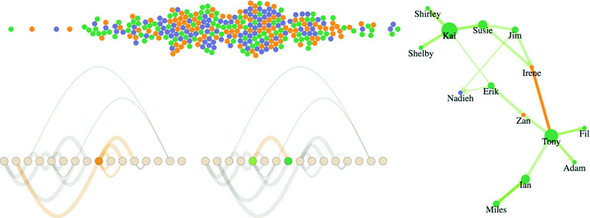
Network analysis and network visualization are more common now with the growth of online social networks like Twitter and Facebook, as well as social media and linked data, all of which are commonly represented with network structures. Network visualizations like the kind you’ll see in this chapter, some of which are shown in figure 7.1, are particularly interesting because they focus on how things are related. They represent systems more accurately than the traditional flat data seen in more common data visualizations.
Figure 7.1. Along with explaining the basics of network analysis (section 7.2.3), this chapter includes laying out networks using xy positioning (section 7.2.5), force-directed algorithms (section 7.2), adjacency matrices (section 7.1.2), and arc diagrams (section 7.1.3).

This chapter focuses on representing networks, so it’s important that you understand a little network terminology as we get started. In general, when dealing with networks you refer to the things being connected (like people) as nodes and the connections between them (such as being a friend on Facebook) as edges or links. Networks may also be referred to as graphs, because that’s what they’re called in mathematics.