This chapter covers
Given the plethora of data visualization tools that emerged in the past decade, you might wonder if learning D3 is worth the trouble. Let us be clear: learning D3 is a wise investment. Although the learning curve can be steep and require dedication, you’ll not only be rewarded with the ability to create all the traditional charts that other libraries offer and customize them at will but also gain the freedom to get off the beaten track and create visualizations that are truly tailored to your data and audience.
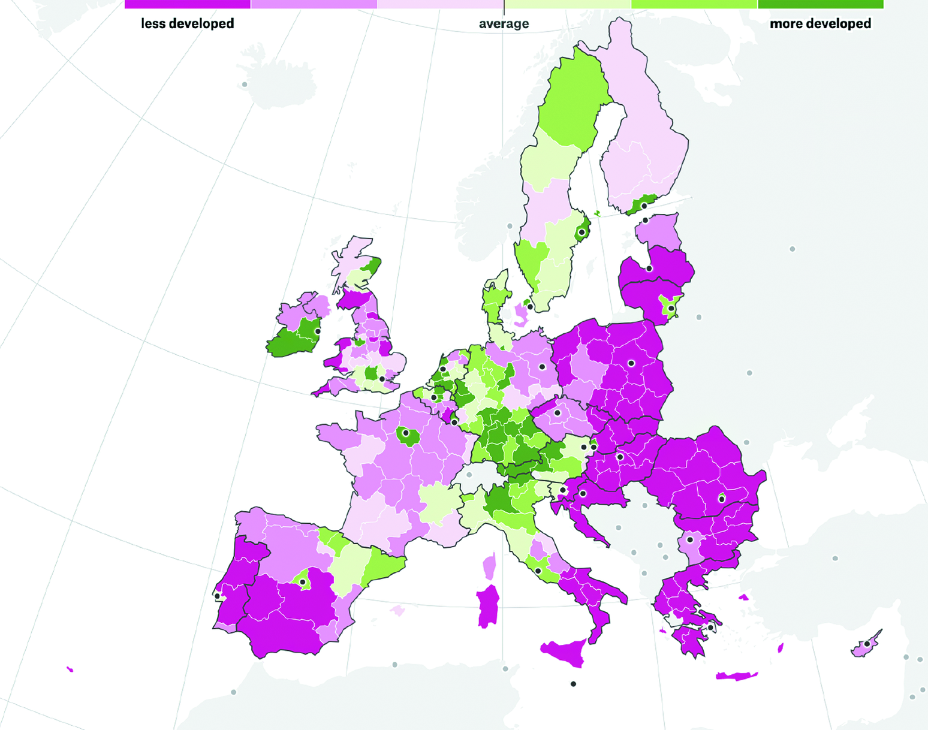
D3.js is the library behind most of the exciting data visualizations on the web. It’s the tool of choice when you want total creative and technical freedom over your data visualizations, whether you make interactive prototypes for research, responsive data dashboards, or scrollytelling data stories such as “Why Budapest, Warsaw, and Lithuania split themselves in two” by Maarten Lambrechts, as shown in figure 1.1.
Figure 1.1 D3 developers have access to a wide range of data representations, such as maps. Here’s an example by Maarten Lambrechts (https://pudding.cool/2019/04/eu-regions/).