This chapter covers
- Understanding D3 layout functions
- Drawing donut charts using the pie layout
- Stacking shapes to generate a stacked bar chart and a streamgraph
- Creating a simple legend
In the previous chapter, we discussed how D3 can calculate the d attribute of complex shapes such as curves, areas, and arcs with its shape generator functions. In this chapter, we’ll take such shapes to another level with layouts. In D3, layouts are functions that take a dataset as an input and produce a new, annotated dataset as an output. This new dataset contains the attributes necessary to draw a specific visualization. For example, the pie layout calculates the angles of each slice of a pie chart and annotates the dataset with these angles. Similarly, the stack layout calculates the position of the piled shapes in a stacked bar chart or a streamgraph.
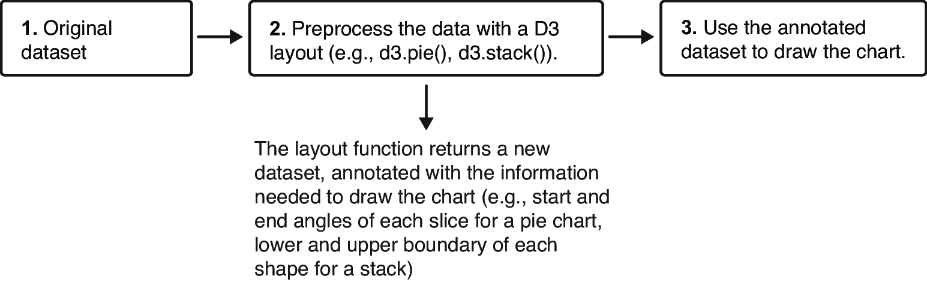
Layouts don’t draw the visualizations, nor are they referred to in the drawing code like shape generators. Instead, they comprise a preprocessing step that formats your data so that it’s ready to be displayed in the form you’ve chosen, as explained in figure 5.1.
Figure 5.1 The layout function is a data preprocessing step used to calculate the information required to draw a specific chart.