15 Operating Airflow in production
This chapter covers
- Dissecting the Airflow components
- Configuring Airflow to scale horizontally using different executors
- Monitoring the status and performance of Airflow visually
- Sending out alerts in case of task failures
Up to now, we’ve focused mainly on the user side of Airflow: building data pipelines. Going forward, we’ll switch gears and discuss what it takes to run and deploy Airflow from an operations perspective. A general understanding of concepts such as distributed software architecture, logging, monitoring, and alerting is assumed, but no specific technology knowledge is required.
15.1 Revisiting the Airflow architecture
Back in chapter 1, we showed the Airflow architecture displayed in figure 15.1. At minimum, Airflow consists of a number of components:
- API server
- Scheduler
- Directed acyclic graph (DAG) processor
- Metastore (also known as the database)
- Workers
- Triggerer (optional component, required for working with deferrable operators)
- Executor (not shown in the figure)
Figure 15.1 High-level Airflow architecture
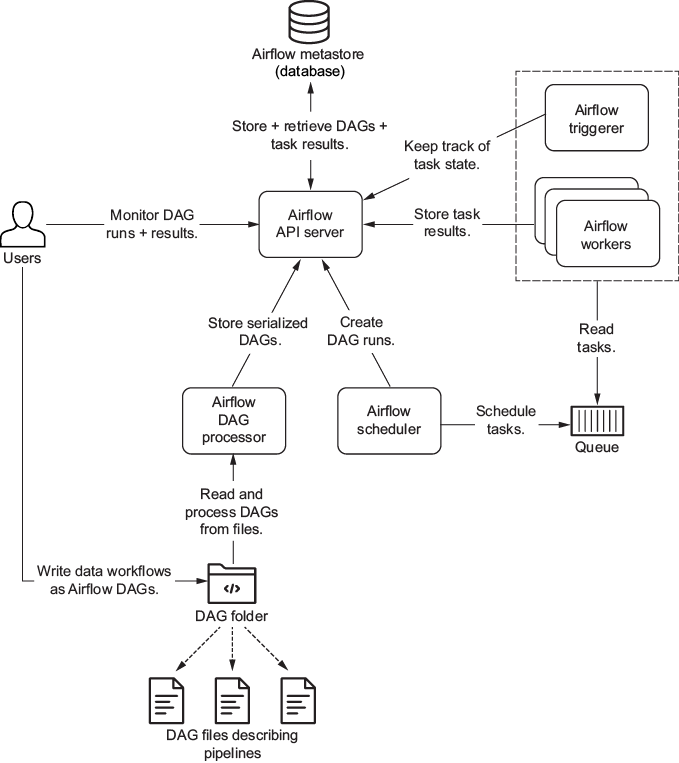
Both the API server and scheduler are Airflow processes. The database is a separate service you must provide to Airflow for storing metadata from the API server and scheduler. The DAG processor must be able to access the folder containing DAG definitions. We briefly describe each component in the following list: