14 Improving training with metrics and augmentation
This chapter covers
- Defining and computing precision, recall, and true/false positives/negatives
- Using the F1 score versus other quality metrics
- Balancing and augmenting data to reduce overfitting
- Using TensorBoard to graph quality metrics
The close of the last chapter left us in a predicament. While we were able to get the mechanics of our deep learning project in place, none of the results were actually useful; the network simply classified everything as non-nodule! To make matters worse, the results seemed great on the surface, since we were looking at the overall percentage of the training and validation sets that were classified correctly. With our data heavily skewed toward negative samples, blindly calling everything negative is a quick and easy way for our model to score well. Too bad doing so makes the model basically useless!
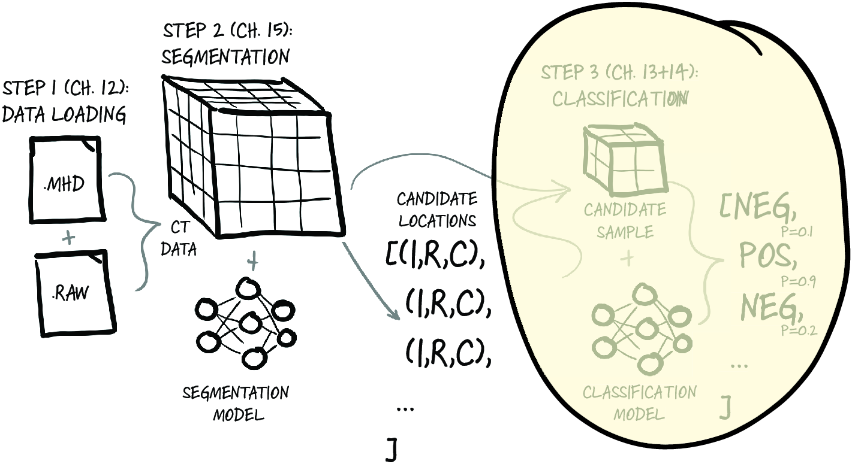
That means we’re still focused on the same part of figure 14.1 as we were in chapter 13. But now we’re working on getting our classification model working well instead of just working. This chapter is all about how to measure, quantify, express, and then improve on how well our model is doing its job.
Figure 14.1 Our end-to-end lung cancer detection project, with a focus on this chapter’s topic: step 3, classification.