12 Improving training with metrics and augmentation


This chapter covers

  • Defining and computing precision, recall, and true/false positives/negatives
  • Using the F1 score versus other quality metrics
  • Balancing and augmenting data to reduce overfitting
  • Using TensorBoard to graph quality metrics

The close of the last chapter left us in a predicament. While we were able to get the mechanics of our deep learning project in place, none of the results were actually useful; the network simply classified everything as non-nodule! To make matters worse, the results seemed great on the surface, since we were looking at the overall percent of the training and validation sets that were classified correctly. With our data heavily skewed toward negative samples, blindly calling everything negative is a quick and easy way for our model to score well. Too bad doing so makes the model basically useless!

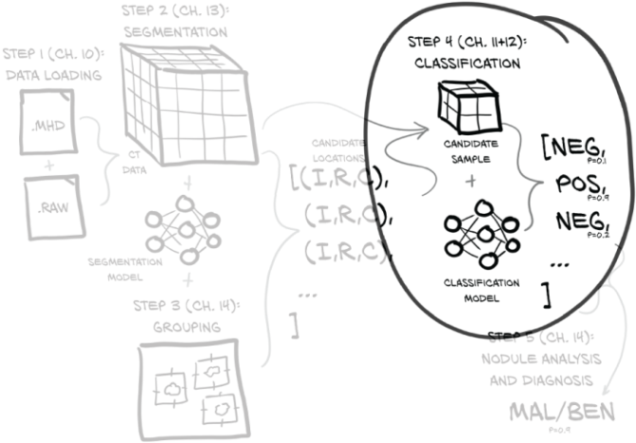
That means we’re still focused on the same part of figure 12.1 as we were in chapter 11. But now we’re working on getting our classification model working well instead of at all. This chapter is all about how to measure, quantify, express, and then improve on how well our model is doing its job.

Figure 12.1 Our end-to-end lung cancer detection project, with a focus on this chapter’s topic: step 4, classification

12.1 High-level plan for improvement

While a bit abstract, figure 12.2 shows us how we are going to approach that broad set of topics.

12.2 Good dogs vs. bad guys: False positives and false negatives

12.3 Graphing the positives and negatives

12.3.1 Recall is Roxie’s strength

12.3.2 Precision is Preston’s forte

12.3.3 Implementing precision and recall in logMetrics

12.3.4 Our ultimate performance metric: The F1 score

12.3.5 How does our model perform with our new metrics?

12.4 What does an ideal dataset look like?

12.4.1 Making the data look less like the actual and more like the “ideal”

12.4.2 Contrasting training with a balanced LunaDataset to previous runs