chapter four
4 The Statistics You (Probably) Learned: T-Tests, ANOVAs, and Correlations
This chapter covers
- Breaking down summary statistics and their underlying logic
- Using parametric statistical tests appropriately
- Understanding and managing the limitations of parametric statistical tests
Take a look at the bar graph below comparing the daily high temperature over a month between New York City and Boston:
Figure 4.1 Comparison of temperatures in July between New York City and Boston
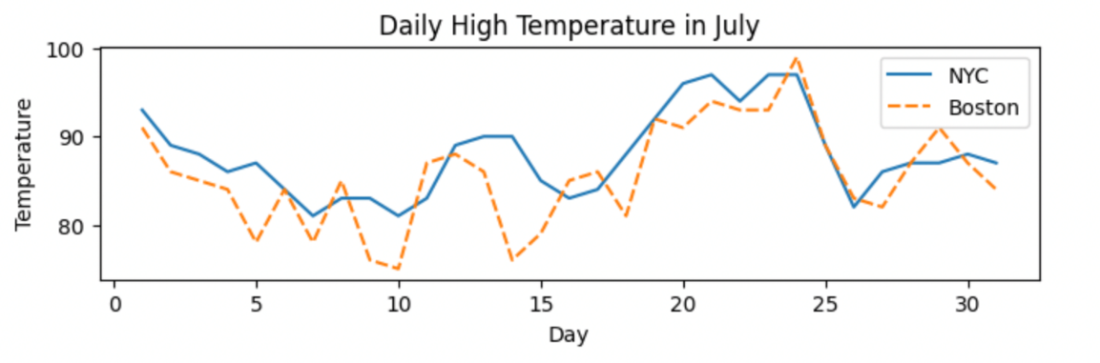
Can you determine which city is warmer in July? You can see that there’s likely a relationship between the weather patterns of each city, which is a sensible hypothesis given the geographical proximity of New York City and Boston. However, there are clear day-to-day deviations in how the daily temperatures fluctuate, making it challenging to visually discern if one city has a higher temperature.
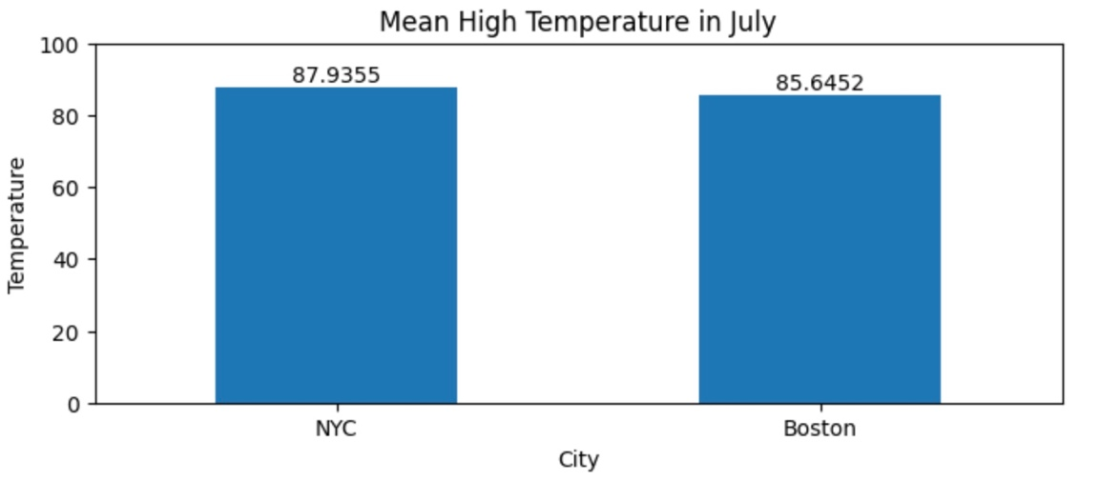
Take a look at an alternate view of the same data, which takes the mean of each daily high temperature per city and plots it on a bar graph:
Figure 4.2 Comparison of the mean daily temperature between New York City and Boston