chapter three

3 Drawing a line close to our points: Linear regression


In this chapter

  • what is linear regression?
  • fitting a line through a set of data points
  • coding the linear regression algorithm in Python
  • using scikit-learn to build a linear regression model to predict housing prices in a real dataset
  • what is polynomial regression?
  • fitting a more complex curve to nonlinear data
  • examples of linear regression in the real world, such as medical applications and recommender systems

In this chapter, we will learn about linear regression. Linear regression is a powerful and widely used method to estimate values, such as the price of a house, the value of a certain stock, the life expectancy of an individual, or the amount of time a user will watch a video or spend on a website. You may have seen linear regression before as a plethora of complicated formulas including derivatives, systems of equations, and determinants. However, we can also see linear regression in a more graphical and less formulaic way. In this chapter, to understand linear regression, all you need is the ability to visualize points and lines moving around.

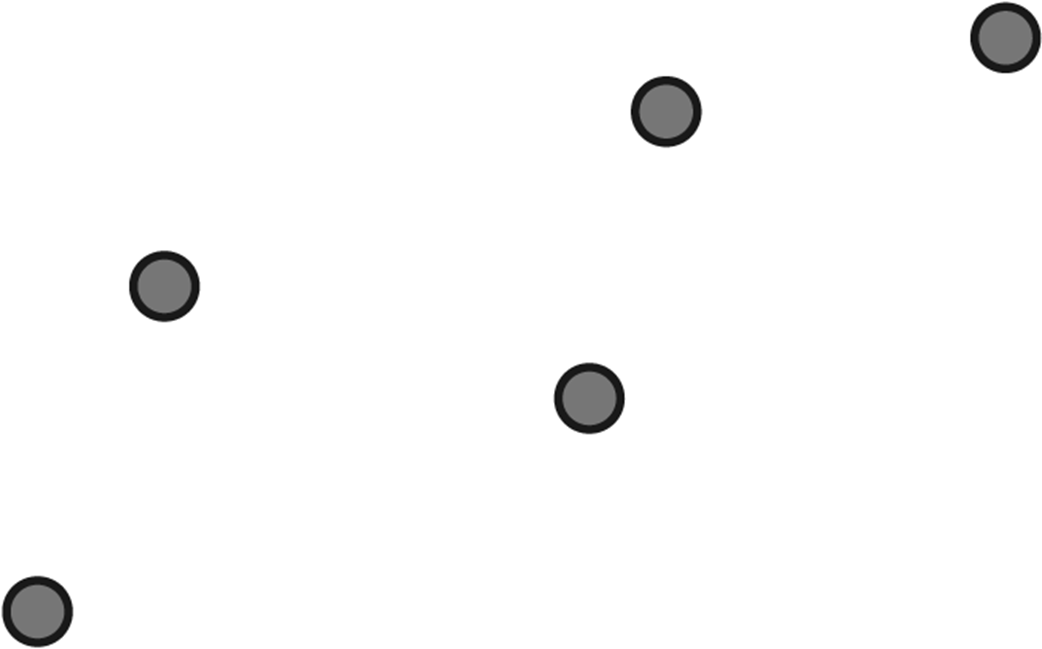
Let’s say that we have some points that roughly look like they are forming a line, as shown in figure 3.1.

Figure 3.1 Some points that roughly look like they are forming a line

The goal of linear regression is to draw the line that passes as close to these points as possible. What line would you draw that passes close to those points? How about the one shown in figure 3.2?

The problem: We need to predict the price of a house

The solution: Building a regression model for housing prices

The remember step: Looking at the prices of existing houses

The formulate step: Formulating a rule that estimates the price of the house

The predict step: What do we do when a new house comes on the market?

What if we have more variables? Multivariate linear regression

Some questions that arise and some quick answers

How to get the computer to draw this line: The linear regression algorithm

Crash course on slope and y-intercept

A simple trick to move a line closer to a set of points, one point at a time

The square trick: A much more clever way of moving our line closer to one of the points

The absolute trick: Another useful trick to move the line closer to the points

The linear regression algorithm: Repeating the absolute or square trick many times to move the line closer to the points

Loading our data and plotting it

Using the linear regression algorithm in our dataset

Using the model to make predictions

The general linear regression algorithm (optional)

How do we measure our results? The error function

The absolute error: A metric that tells us how good our model is by adding distances

The square error: A metric that tells us how good our model is by adding squares of distances

Mean absolute and (root) mean square errors are more common in real life

Gradient descent: How to decrease an error function by slowly descending from a mountain

Plotting the error function and knowing when to stop running the algorithm