Chapter 3. Dynamic graphics
This chapter covers
- Using the <canvas> element to draw shapes, text, and images
- Transforming existing images with <canvas>
- Using Scalable Vector Graphics (SVG) in your web pages
- The strengths and weaknesses of <canvas> and SVG
- Cross-browser support
In this chapter, you’ll learn about HTML5’s facilities for dynamic graphics—graphics that can change in response to user input, data, or simply time passing. This could include charts representing network activity or the location of people on a map.
The <canvas> element is an image you can create with JavaScript. The markup for it is similar to an <image> element in that you can specify a width and a height; but it has starting and closing tags that can enclose fallback content, and it doesn’t reference an external source:
<canvas id="mycanvas" width="320" height="240"
style="outline: 1px solid #999;">
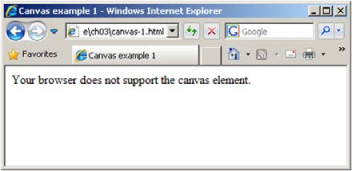
Your browser does not support the canvas element.
</canvas>
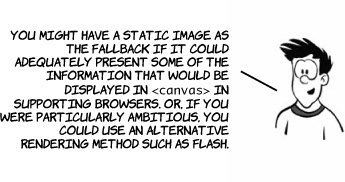
In a browser that doesn’t support <canvas> the fallback content is displayed, as in this screenshot.
| Browser support quick check: <canvas> | Canvas 2D context | Canvas text | |
 |
4.0 | 4.0 | |
 |
2.0 | 3.5 | |
 |
9.0 | 9.0 | |
 |
9.0 | 10.5 | |
 |
3.1 | 4.0 |