Chapter 11. Debugging and optimizing your application
This chapter covers
- Debugging applications without tools
- Using breakpoints and stepping through your code
- Watching variables
- Optimizing the performance of an app
You’ve written some great-looking apps that work well, but what happens when things don’t go so smoothly? Sometimes a newly written app may behave unexpectedly or even crash. These problems are caused by programming errors often called bugs, and even the most experienced programmers make them.

Because bugs aren’t automatically detected by Xcode, they can be more difficult to find and fix, but don’t worry. Fortunately, there are tools and techniques you can use to fix bugs: a process called debugging. And, like a mechanic tuning up a car, there are even things you can do to make a bug-free app faster and more efficient—this is called optimization. In this chapter, you’ll learn how to debug and optimize your code to make sure your app runs as smoothly as possible.

Xcode has a wonderful debugger, which we’ll cover later in the chapter. But first: patience, grasshopper. A number of coding tricks allow you to test for bugs without using the debugger. Once upon a time, this was the only way to debug a program, and these techniques are still useful today—particularly when a bug is intermittent and hard to reproduce.
In order to learn about debugging, you need a bug. Let’s take a walk down memory lane and introduce a bug to the trusty old flashcard app. Open FCCard.m, and find the line in initWithQuestion that chooses a random slot for the correct answer. Change the 3 to a 4. When you’re done, the line should look like this:
The original code correctly picked a 0, 1, or 2 to randomly assign the question’s answer to one of three buttons. With this bug, the number 3 may also be chosen. If the random-number generator picks a 3, the program will try to place the answer in a button that doesn’t exist. This will cause the program to crash. Occasionally, because it’s random, the program won’t choose a 3 for any question and will run correctly; but most of the time the program will crash.

You’re now going to learn about debugging by pretending you don’t know about the new bug. Take a nice long look at a neuralyzer and forget the bug ever existed.

Finding bugs is sometimes like detective work. You need to look for clues. When you run the FlashCards app, it loads correctly. It only crashes when you press the Show States or Show Capitals button. And, if you get lucky, the app doesn’t crash and runs fine. From these facts, you can deduce that the bug is located somewhere in showCards. (Remember, you forgot what the problem is.) Fortunately, you can use NSLog to find where the crash happens.
NSLog prints strings to a special window in Xcode called the console. Add the statement NSLog(@"Shall you play a game?"); to the program, and you’ll see the log message “Shall you play a game?” appear in the console when the app reaches the NSLog call in the program. You can use this log to see if and when a particular section of code is ever run.

To locate a crash, you can call NSLog at the beginning and end of a section of code. If you see only one of the two expected messages in the console, you know that the bug is somewhere between the two calls to NSLog. Because you have a pretty good idea that this bug is located after one of the Show buttons is pressed, start by putting NSLog statements at the beginning and end of allocStateCards in FCAnswerKey.m:
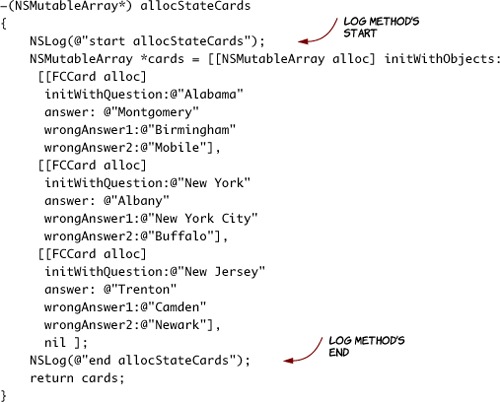
Although you can use any string you want in the log statements, you use @"start allocStateCards" and @"end allocStateCards" to make the messages easy to recognize in the console. It’s important that the last call to NSLog is before the return statement. If the NSLog was placed after return, it would never be called. You can also place NSLog statements at the beginning and end of allocCapitalCards if you want.
Run your app. When it crashes, Xcode should make the debug area with the NSLog messages visible automatically. If it’s not visible, you can expand it manually by clicking the expand icon at lower-left in the Xcode window.


Notice that there is a line that reads start allocStateCards but not one that says end allocStateCards. This confirms your suspicion that the bug is located somewhere in allocStateCards (or one of the methods it invokes). Also notice the error message printed out after the log message. It tells you that the error is caused by a call to exchangeObjectAtIndex:withObjectAtIndex: with a value that is out of bounds. This gives you another clue that you’ll explore in the next section.


The log statements confirmed that the bug is somewhere in allocStateCards. You also got a bonus clue from the console that said you’re trying to call an NSMutableArray’s exchangeObjectAtIndex:withObjectAtIndex: with a value that is out of bounds. The only place you use this method is in initWithQuestion in FCCard.m when you try to modify answers. To confirm that this is the cause of the problems, you’ll use another debugging technique called an assertion.
Assertions allow you to test a value or condition in your code. If the condition is true, your program keeps running normally. But if the condition is false, a statement is printed to the debug console and an exception is thrown, which usually causes the program to stop executing. For example, if you write NSAssert(foo = 10, @"foo doesn't equal 10"), your program will run fine if the variable foo is 10 but will stop and print "foo doesn't equal 10" to the console if foo has any other value. An assertion is like a centurion guarding a gate who asks a question and only lets those with the correct answer pass. Because the assertion allows you to send messages to the console only when there is a problem, it’s useful with bugs that occur infrequently.
You suspect the problem is in initWithQuestion, and you know there should be only three buttons in answers, so create an assertion in initWithQuestion that won’t let exchangeObjectAtIndex be called with a value greater than 2.

Now, when you run the app, you see in the console an assertion failure that says 'randomAnswerSlot is greater than 3!'. You can use NSAsserts to guarantee that different parts of your program are working the way you think they should be. If an assertion fails, your program stops running and you’ve found the problem.
Now that you’ve identified the bug, let’s fix it by changing the 4 back into a 3. You should be able to run the app without it crashing and without the NSAssert printing a message in the console. Congratulations on finding and fixing your bug!
Sometimes you can’t use the simulator or Xcode to debug a program. This is particularly true for apps that use any of the devices’ sensors. Suppose you have an app that uses GPS data and only crashes when you’re moving. Although you could try to walk around town balancing your iPhone and a laptop in your hands like a deranged juggler, it’s much easier to use the techniques introduced in this section.
We’ll talk about deploying an app to a real device in the next chapter, so try to be patient for now. (We know it’s hard to wait!) One way to make an app give you feedback is to set the text field of a label. You already know how to do this; you did it in chapter 3. The downside of this approach is that you have to modify a view to display a message. Depending on your app, this may required modifying multiple views and XIBs.

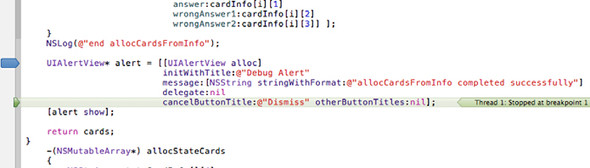
Another option is to pop up a dialog box with the message, value, or condition you want to monitor. The advantage of this approach is that it doesn’t require modifying any of your existing views. To demonstrate this technique, you’ll add a pop-up alert to allocCardsFromInfo so you can confirm that it’s successfully completing without having to look at the log messages in the console. To create a pop-up, add the following code to the end of allocCardsFromInfo in FCAnswerKey.m. As you did with NSLog, make sure you add these statements before the return statement.
Listing 11.2. FCAnswerKey.m: adding Alert
UIAlertView* alert =
    [[UIAlertView alloc]
        initWithTitle:@"Debug Alert"
              message:[NSString
                  stringWithFormat:@"allocStateCards completed"]
              delegate:nil
              cancelButtonTitle:@"Dismiss"
              otherButtonTitles:nil];
[alert show];
Now when you run the app you’ll see a dialog box after the cards are created.
You can use alerts like log statements or combine them with if statements to behave like assertions. With alerts, you don’t even need Xcode to debug a program, which will be especially handy when you start running your app on a real iPhone.
Although it’s sometimes necessary to debug a program without any tools, Xcode’s debugger is usually more convenient. And now that you know how to debug an app without any tools, you’ll appreciate the power and flexibility provided by the debugger all the more.

In the last section, you used logging statements, assertions, and alert boxes to debug your program. Although these techniques are effective, they have the disadvantage of requiring you to modify your code. The Xcode debugger allows you to debug without modifying a line of code. Using the debugger, you can watch variables as they’re changed and step through the program line by line as it’s executing. The debugger makes you a superhero with the ability to stop time using breakpoints. The variable watcher gives you X-ray vision with the ability to peer into your program’s inner workings.
Breakpoints allow you to pause a program so you can examine variables. If a program isn’t working as expected, it’s useful to make sure the variables have the values you expect. Breakpoints are like giant stop signs that tell Xcode to stop executing and wait. To set a breakpoint, click the gutter to the left of the code, and Xcode will mark the line with a dark-blue arrow. This arrow informs you that Xcode will pause before this line is executed. Clicking an existing arrow toggles individual breakpoints on and off. Disabled breakpoints are translucent.

Try placing a breakpoint next to the line that creates the alert you added in the last section, and then run your app. When Xcode stops at the breakpoint, it accentuates the point of execution by highlighting the relevant line.
When you’re writing a complicated program, it’s sometime hard to tell if a particular line of code is being executed. Breakpoints are one way to check on a section of code. You can place as many breakpoints as you want. If the debugger doesn’t stop on your breakpoint, it means that line isn’t being run.
Just like pressing a Play button to play a paused song, your can press the debugger’s Continue button to resume running an app paused by a breakpoint. When you press Continue, the program continues running until another breakpoint. The Continue button is the first of four debugger controls found above the variable view.

In addition to allowing your program to continue running after a breakpoint, you can use the debugger to execute code one line at a time. Stepping through the code lets you observe the effects of each line as it executes. Step Over and Step Into are located next to the Continue button. If the current line doesn’t send an object a message, both buttons tell the debugger to execute the current line and advance to the next. But if the current line sends a message, Step Over tells the debugger to send the message and advance to the next line of code after the message is handled.

Similarly, if the current line of code sends a message, Step Into tells the debugger to move inside the invoked method so you can see its inner workings. Once inside the method, you can step through its execution or step out of the method and return to the line after the initial message was sent.
When Xcode stops on a breakpoint, it makes the debug area visible. On the right, you see the console in which you viewed the NSLog statements, and to its left you see the Variables View. The Variables View allows you to observe variables to confirm that they have their expected value.

As its name implies, the Variables View lets you see the value of variables. You can click the small arrow to the left of an object to look at variables contained within the object. Amazingly, you can even doubleclick a value and type to assign a new value to a variable. Let’s say you’re debugging the FlashCards app, and you notice that 3 was chosen as the random number. You can manually change that 3 to a valid number and see how the program runs with that change.

At the top of the Variables View is a pull-down menu that offers these choices: Auto, Local Variables, All Variables, Registers, Globals, and Statistics. Auto displays the variables that are relevant to the current line in the debugger and will usually be the most useful.
Sometimes you need to set a breakpoint in a frequently called method or a loop, but you don’t want your program to stop every time execution reaches the breakpoint. Xcode allows you to set a breakpoint that pauses the program only under certain conditions.
To create a conditional breakpoint, set a breakpoint as you normally would by clicking the gutter. Then right-click (or Ctrl-click) the blue arrow and enter an expression in the Condition text field. If the expression is true when the program reaches the breakpoint, the program will pause, and you can then step through the code or use the Variables View. If the condition evaluates to false, the program will keep running. You can also tell the debugger how many times the breakpoint should be ignored.
It isn’t enough just to write a program that doesn’t crash. An app should be responsive and efficient. Xcode provides a number of tools called instruments that help to make apps run as smoothly as possible.

Now that your app doesn’t crash, you can use Xcode to give it a tuneup. Profiling your code helps you write applications that run faster and use less memory. A good tune-up is the difference between an app that works and one that runs Fast and Furious.
Xcode provides a number of instruments to profile your code. Profiling allows you to measure things like how long individual methods take to execute and how much memory the program is using. You can use profiling to find and fix inefficiencies in the code. To profile your code, choose Profile from the Product menu in Xcode’s menu bar. Doing so opens a window in which you can choose an individual profiling tool.

Clicking an instrument displays its description in the lower pane. The Profile button in the lower-right corner runs the selected profiler.
If your application is running slowly, the Time Profiler can help you figure out why. The Time Profiler samples your code every millisecond while the app is running and records what is executing. After you’re done profiling the program, the Time Profiler presents its data so you can figure out which methods are taking the most time and know where to focus you optimization efforts.
The code you’ve written so far works pretty well, so, as you did with the bug, you’ll intentionally introduce some inefficient code. Open FCViewController.m, and add the following to the beginning of showCards:
NSMutableArray *uselessArray = [[NSMutableArray alloc] init];
for(int i = 0; i < 10000; i++) {
    [uselessArray addObject:[NSNumber numberWithInt:i]];
}

for(int i = 0; i < 10000; i++) {
    [uselessArray removeObject:[NSNumber numberWithInt:i]];
}
Now try running the app in the simulator. You’ll notice a delay after you press Show States and Show Capitals: your program is needlessly adding and removing numbers from a mutable array.

Let’s pretend you didn’t know the cause of the delay and wanted to find the culprit. Open the Profile window, select the Time Profiler, and click the Profile button. Doing so opens a new Instruments window and launches the app in the simulator. Run through the game a couple of times. As you run the app, you’ll notice some activity in the other window. Quit the simulator or press the Stop button (the second button from the left on the toolbar) to stop profiling, and look at the Time Profiler.

Toward the top of the window is a rectangle containing a graph. This graph shows you CPU utilization. Below that, you should see a Call Tree listing all the functions and methods used in your program, along with their running time in milliseconds and as a percentage of total running time. Make sure Invert Call Tree is selected in the Cell Tree settings at left in the windows.


Whoa! There’s a lot of information in that call stack. Finding a performance bottleneck is like looking for a needle in a haystack. Fortunately, you can do a number of things to reduce the size of the haystack and quickly zero in on the problem.
The first thing you can do is tell Xcode to only display timing information for the slice of time when you’re experiencing a slowdown. If you look at the CPU utilization graph, you’ll notice a spike in usage that corresponds to each time you started playing the game.

You can limit your search to this spike by clicking and dragging the mouse across the spike while holding down the Option key. As the CPU usage graph is selected, the Call Tree below is filtered to show only methods and functions from the highlighted time slice.
Next you can make the Call Tree easier to read by having Xcode display only the information that is most likely to be relevant. In the Call Tree settings menu at left, in addition to Invert Call Tree, select Hide System Libraries and Show Obj-C Only. This will limit what is displayed to only methods you’ve written.


The result should look much more manageable. Now you should see a handful of methods, most of which you’ve implemented. Because they’re sorted by running time, the most likely performance problem will be at the top of the list. In this case, it’s [FCViewController showCards:]. Double-click [FCViewController showCards:] to see a detail view of the method. Highlighted in red is the costliest line of code: in this case, [uselessArray removeObject:[NSNumber numberWithInt:i]];.

Here you can clearly see that the one line removing objects from uselessArray is taking 99.9% of the running time. For comparison, let’s replace the costly second for loop with the single line [uselessArray removeAllObjects];. Calling removeAllObjects removes everything in uselessArray just as your loop did, only more efficiently. Now try running the code; even without the profiler, you can tell that the program is more responsive. Using the Time Profiler, you can see that showCards: is no longer the costliest method and is running significantly faster. Leave the for loops in your code, because you’ll examine their memory usage in the next section.


Computers use memory to store running programs and their data. iPhones and iPads have much less memory than traditional computers, so iOS app developers should be especially careful to use memory efficiently. To profile memory usage, Xcode provides the Allocations instrument.
There are potentially two types of memory problems: short-term memory allocations and long-term memory leaks. A memory leak is caused by allocated memory not becoming deallocated after it’s needed. Due to the introduction of Automated Reference Counting (ARC) memory to iOS, leaks are less common, but they can still happen. A memory leak will cause your program to use more and more memory over time, which will eventually cause iOS to terminate the app.
To check your app’s memory usage, open the Profile window and double-click the Allocations icon. You’ll see a window similar to the one opened by the Time Profiler. Before you click Show States or Show Capitals, click the Mark Heap button to the left of the Instruments window. The heap is the pool of memory used by your app.

Play the game at least five times, and click Mark Heap before you press Start Again. Mark Heap tells the iOS record-profiling data so you can refer to it later. Playing the game five times will let you see how your app performs over time. Each time you click Mark Heap, you’ll see a new heapshot appear in the Snapshot column.

The most important column to look at for the heapshots is Heap Growth. Heap growth measures how much additional memory each heapshot is using. In a perfect world, the number would be 0, meaning your program doesn’t need extra memory to run. Notice that after the first few runs of the game, the heap growth value is usually close to 1. This is good, because it means the program’s memory footprint is barely growing. Even better, if you expand one of the heapshots by clicking the small triangle, you’ll see that the two biggest contributors to the heap growth are related to CardResult. Some memory growth here makes sense because the app is supposed to store the results of games. If the heap growth was consistently a big number, it would mean your program was constantly eating memory and that you’d need to find the cause if you wanted your program to run smoothly.
At the top of the window is a graph representing the app’s total memory usage. Notice the sawtooth pattern that results from the for loops adding numbers to and removing them from an array.
Keeping an eye on total memory utilization can help you diagnose and avoid short-term memory spikes.

You’ve skillfully squashed a bug that caused your app to crash, by using log statements, assertions, and alert boxes. You now know how to use the debugger to step through a program’s operations, and you found performance bottlenecks and monitored memory usage. Your app is finally ready to leave the simulator and run on a real iPhone.