chapter ten
This chapter covers
- Understanding how to troubleshoot a misconfigured workload
- How to detect and prevent misconfigurations using
istioctl
- Explains how to use
istioctlto investigate service proxy configuration
- Explains how to make sense of Envoy logs to understand service proxy behavior
- Gain insights into your apps using the collected telemetry
When communicating over the networking, many things can go wrong as we’ve demonstrated throughout this book. A big reason why Istio exists is to help shine a light on network communication when things go wrong as well as put in place remediation capabilities like timeouts, retries, and circuit breaking so that applications can respond to network issues automatically. The service proxy that gets deployed alongside each workload can do a lot to give us a very detailed view of what’s happening on the network, but what happens with the proxy itself behaves unexpectedly?
Figure 10.1. Components that participate to route a request
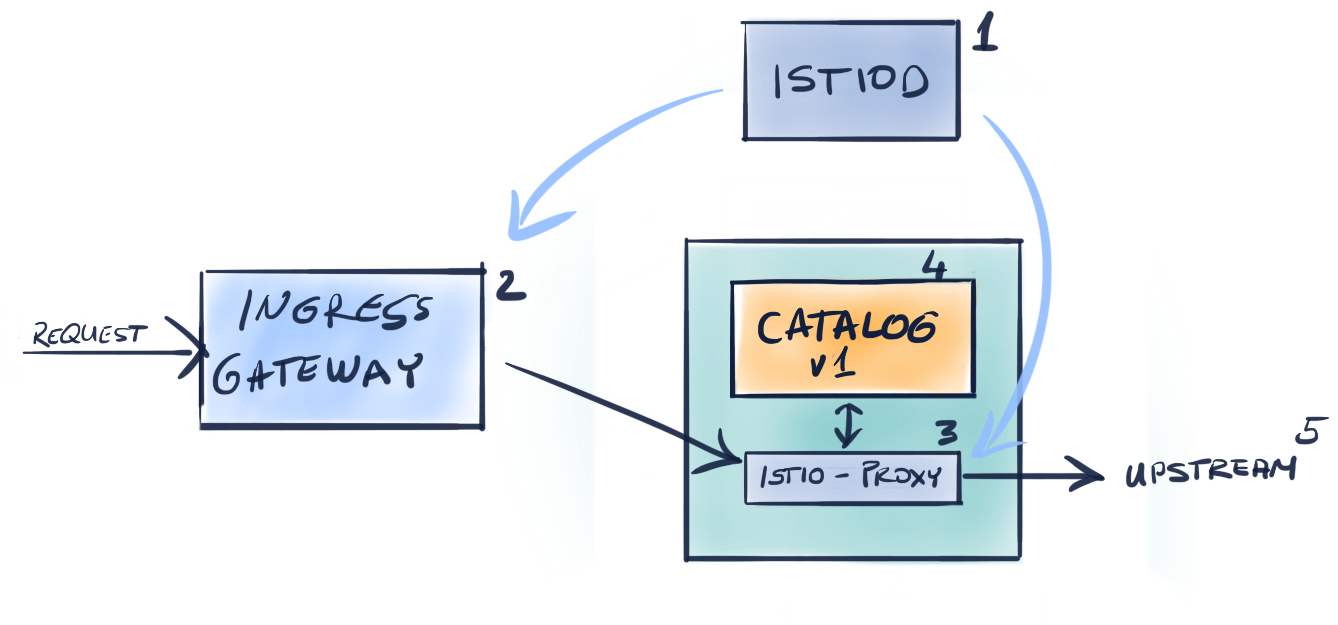
As seen in the figure above the components that participate to serve a request are:
- Istiod which ensures the data plane is synchronized to the desired state
- The Ingress Gateway that admits traffic into the cluster
- The service proxy that provides access control and handles traffic from the downstream to the local application
- The application itself, that serves the request. The application might request another service which continues the chain to
- Another upstream service…