This chapter covers
- Using tracing between microservices
- Viewing traces with the Jaeger UI
- Injecting a tracer to customize attributes on a span
- Tracing beyond HTTP
Any form of application observability requires tracing execution paths within a distributed system. With the rise of distributed systems, the ability to debug and step through code disappears because developers are now dealing with many services. Tracing is the new debugging when dealing with distributed systems. In addition, being able to visualize the bottlenecks in services by observing higher execution times are critical. By no means does this discount the importance of observing metrics, discussed in chapter 10, but it is often necessary to drill deeper into a specific execution path to determine the root of a problem.
In essence, tracing is a key tool in the operations' toolbox for observing a running production system. Tracing is the best means of debugging the execution path of a distributed system.
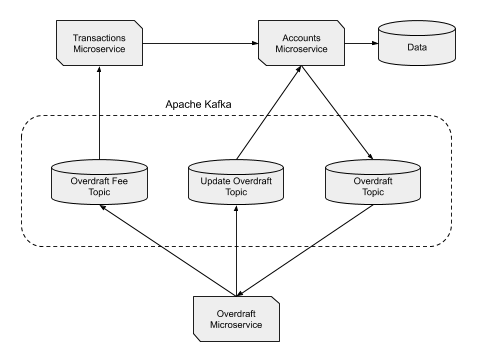
The example architecture from chapter 8 will be updated to include tracing, for highlighting the impact of tracing across different communication mechanisms. These include HTTP calls, both into a service and to another service, database interactions, and sending or receiving messages from Apache Kafka.
Figure 11.1. Microservice Architecture