chapter seven
This chapter covers:
- Adding additional data to your analysis
- Using pandas to fill in missing values in your data
- Visualizing your time-series data
- Using a neural network to generate forecasts
- Generating power consumption forecasts with DeepAR
In chapter 6, you worked with Kiara to develop a AWS SageMaker DeepAR model to predict power consumption across her company’s 48 sites. You had just a bit more than one year’s data for each of the sites, and you predicted the temperature for November, 2018, with an average percentage error of less that 6%. Amazing! Let’s expand on this scenario by adding additional data for our analysis and filling in any missing values. First, let’s take a deeper look at DeepAR.
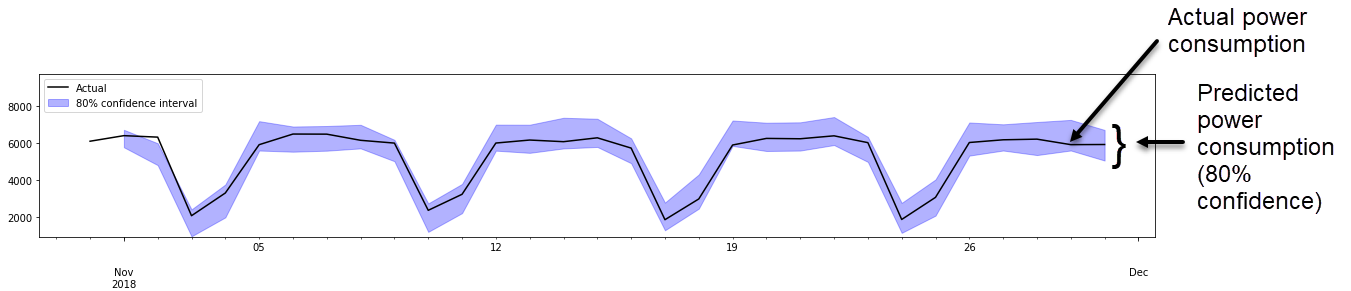
The DeepAR algorithm was able to identify patterns such as weekly trends in our data from chapter 6. Figure 7.1 shows your predicted and actual usage for site 33 in November. This site follows a consistent weekly pattern.
Figure 7.1. Predicted versus actual consumption from site 33 using the DeepAR model you built in chapter 6