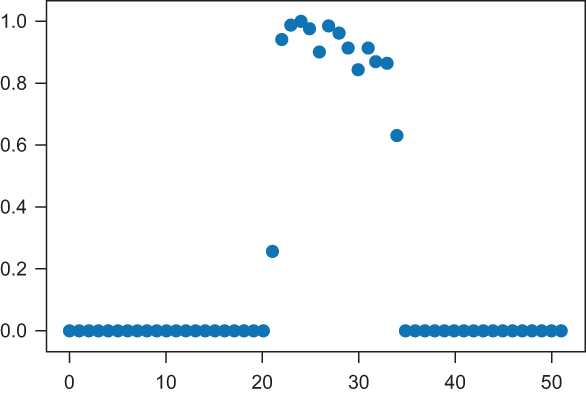
Armed with the power of regression-based prediction and TensorFlow, you can get started working on real-world problems involving more of the steps in the machine-learning process, such as data cleaning, fitting models to unseen data, and identifying models that aren’t necessarily an easy-to-spot best-fit line or a polynomial curve. In chapter 3, I showed you how to use regression when you control all steps of the machine-learning process, from using NumPy to generate fake data points that nicely fit a linear function (a line) or a polynomial function (a curve). But what happens in real life, when the data points don’t fit one of the patterns you’ve seen before, such as the set of points shown in figure 4.1? Take a close look at figure 4.1. Is a linear regression model a good predictor here?
chapter four