chapter thirteen
This chapter covers
- Monitoring Jenkins and its jobs effectively
- Forwarding Jenkins build logs to a centralized logging platform
- Parsing Jenkins logs into something structured and queryable
- Exposing Jenkins internal metrics with Prometheus
- Building interactive dashboards with Grafana
- Creating metric-based alerts for Jenkins
In the previous chapters, you learned to design, build, and deploy a Jenkins cluster from scratch by using automation tools; you also learned to set up a fully working CI/CD pipeline for several cloud-native applications. In this chapter, we will dive into advanced Jenkins topics: monitoring a running Jenkins server and detecting anomalies and resource starvation. Along the way, we will cover how to build a centralized logging platform for Jenkins logs.
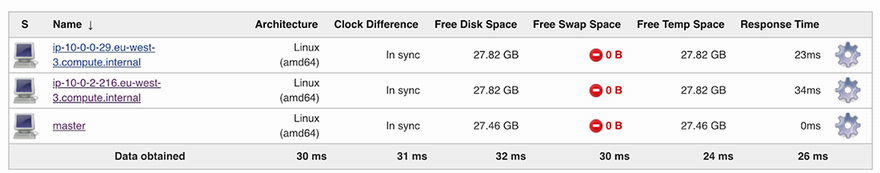
The cluster we built in chapter 5 consists of a Jenkins master and workers, with each node running inside an EC2 instance. Figure 13.1 shows a typical Jenkins node configuration.