13 Collecting Continuous Delivery Metrics
This chapter covers
- Monitoring Jenkins and its jobs effectively
- Forwarding Jenkins build logs to a centralized logging platform
- Parsing Jenkins logs into something structured and queryable
- Exposing Jenkins’s internal metrics with Prometheus
- Building interactive dashboards with Grafana
- Creating metric-based alerts for Jenkins
In the previous chapters, we have learned how to design, build, and deploy a Jenkins cluster from scratch using automation tools as well as how to set up a fully working CI/CD pipeline for several cloud-native applications. In this chapter, we will dive into advanced Jenkins topics and explore how to monitor a running Jenkins server and how to detect anomalies and resource starvation. Along the way, we will cover how to build a centralized logging platform for Jenkins logs.
13.1 Monitoring Jenkins Cluster Health
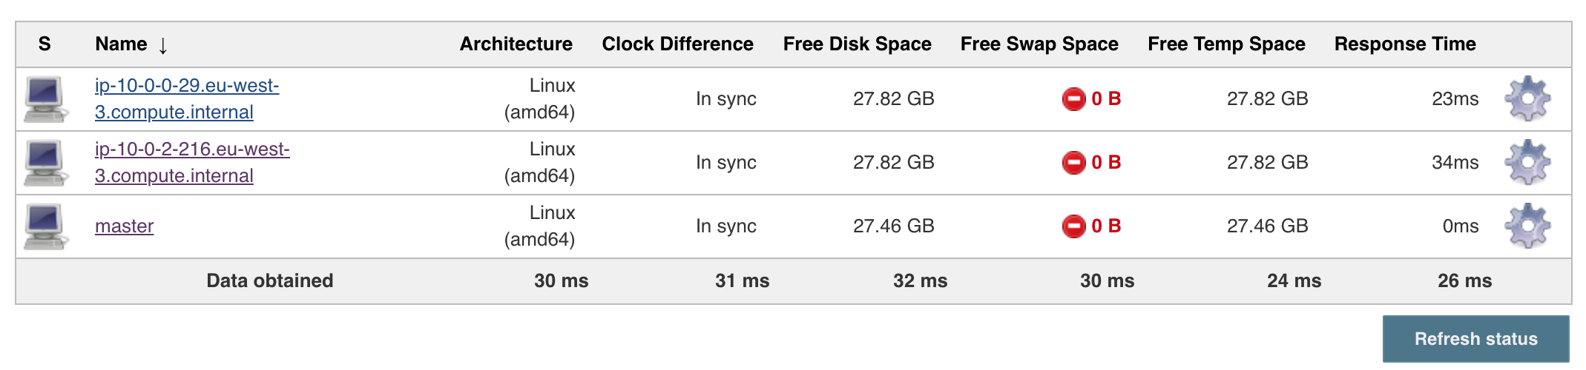
The cluster we built in Chapter 5 consists of a Jenkins master and workers, each node is running inside an EC2 instance. The following screenshot shows a typical Jenkins nodes configuration:
Figure 13.1. Jenkins distributed build architecture
So far the Jenkins cluster is working as expected. However, you should never take your IT infrastructure for granted. Your Jenkins master or workers one day will break and will need to be replaced. So, how do you know if your Jenkins cluster is working effectively if you aren't monitoring it?