This chapter covers
- Decision tree–based models
- Generalized additive models
- Support vector machines
In chapter 7, you learned about linear methods for fitting predictive models. These models are the bread-and-butter methods of machine learning; they are easy to fit; they are small, portable, and efficient; they sometimes provide useful advice; and they can work well in a wide variety of situations. However, they also make strong assumptions about the world: namely, that the outcome is linearly related to all the inputs, and all the inputs contribute additively to the outcome. In this chapter, you will learn about methods that relax these assumptions.
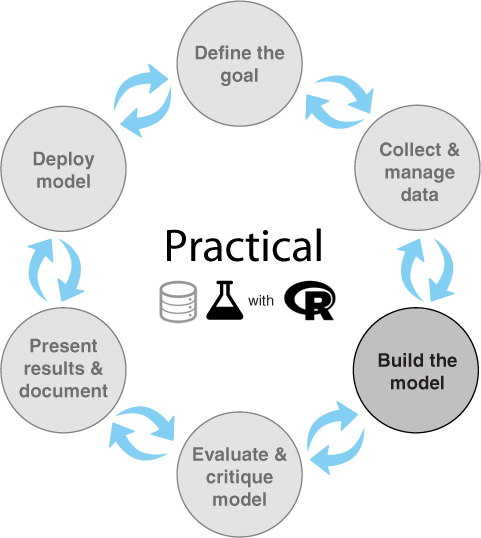
Figure 10.1 represents our mental model for what we'll do in this chapter: use R to master the science of building supervised machine learning models.
Example
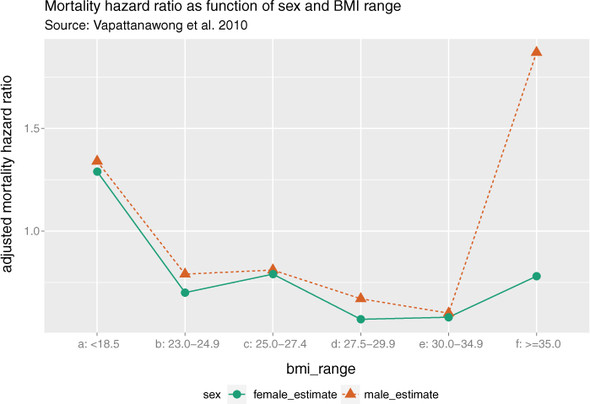
Suppose you want to study the relationship between mortality rates and measures of a person’s health or fitness, including BMI (body mass index).
Figure 10.2 shows the relationship between BMI and mortality hazard ratio for a population of older Thais over a four-year period.[1] It shows that both high and low BMI are associated with higher mortality rates: the relationship between BMI and mortality is not linear. So a straightforward linear model to predict mortality rates based (partly) on BMI may not perform well.