Chapter 4. Managing data
This chapter covers
- Fixing data quality problems
- Organizing your data for the modeling process
In chapter 3, you learned how to explore your data and to identify common data issues. In this chapter, you’ll see how to fix the data issues that you’ve discovered. After that, we’ll talk about organizing the data for the modeling process.[1]
1 For all of the examples in this chapter, we’ll use synthetic customer data (mostly derived from US Census data) with specifically introduced flaws. The data can be loaded by saving the file exampleData.rData from https://github.com/WinVector/zmPDSwR/tree/master/Custdata and then running load("exampleData.rData") in R.
In this section, we’ll address issues that you discovered during the data exploration/visualization phase. First you’ll see how to treat missing values. Then we’ll discuss some common data transformations and when they’re appropriate: converting continuous variables to discrete; normalization and rescaling; and logarithmic transformations.
Let’s take another look at some of the variables with missing values in our customer dataset from the previous chapter. We’ve reproduced the summary in figure 4.1.
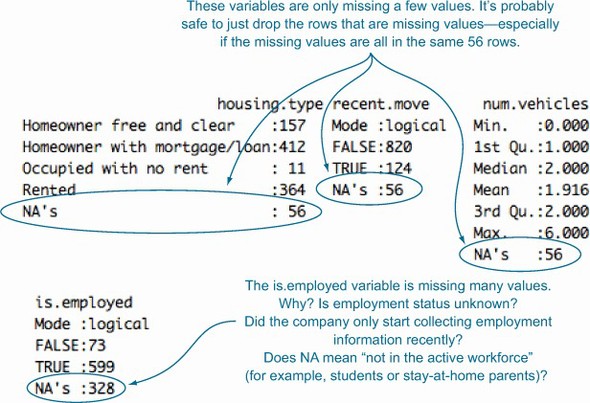
Fundamentally, there are two things you can do with these variables: drop the rows with missing values, or convert the missing values to a meaningful value.