Appendix A. Graphical user interfaces
You turned here first, didn’t you? By default, R provides a simple command-line interface (CLI). The user enters statements at a command-line prompt (> by default), and each command is executed one at a time. For many data analysts, the CLI is one of R’s most significant limitations.
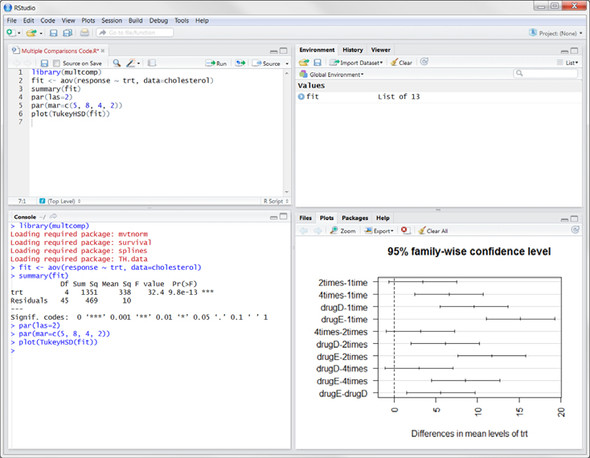
There have been a number of attempts to create more graphical interfaces, ranging from code editors that interact with R (such as RStudio), to GUIs for specific functions or packages (such as BiplotGUI), to full-blown GUIs that allow you to construct analyses through interactions with menus and dialog boxes (such as R Commander).
Several of the more useful code editors are listed in table A.1.
Table A.1. Integrated development environments and syntax editors
| Name |
URL |
|---|---|
| RStudio | www.rstudio.com/products/RStudio |
| Eclipse with StatET plug-in | www.eclipse.org and www.walware.de/goto/statet |
| Architect | www.openanalytics.eu/architect |
| ESS (Emacs Speaks Statistics) | http://ess.r-project.org |
| JGR | http://jgr.markushelbig.org/JGR.html |
| Tinn-R (Windows only) | http://nbcgib.uesc.br/lec/software/editores/tinn-r/en |
| Notepad++ with NppToR (Windows only) | http://notepad-plus-plus.org and http://sourceforge.net/projects/npptor |
These code editors let you edit and execute R code and include syntax highlighting, statement completion, object exploration, project organization, and online help. A screenshot of RStudio is shown in figure A.1.