concept graphic in category arcgis

This is an excerpt from Manning's book ArcGIS Web Development.
HTML5 is the latest revision of the HTML standard. Most modern browsers support it—or at least support most HTML5 features. I’ll cover some of the capabilities of HTML5 in chapter 4, but when it comes to drawing graphics on a map in the ArcGIS API for JavaScript, a couple of HTML5 features are important to note. The first is SVG (Scalable Vector Graphics), which is part of HTML5 but is also a specification of its own. The HTML5 canvas element is used to draw graphics, but it doesn’t draw vector graphics. Instead, canvas draws in bitmap data, which is based on pixels.
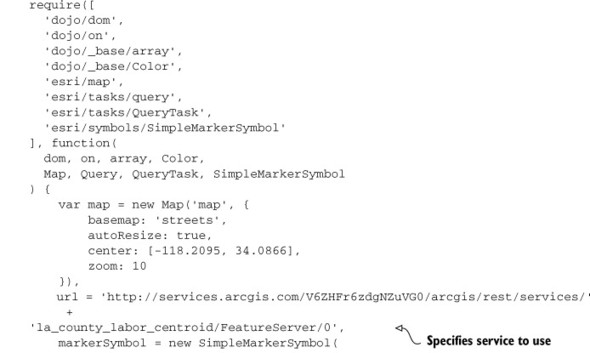
So far I’ve covered how to add graphics to the map by clicking locations on the map. This approach is useful in many workflows, but how would you add graphics to a map you’re not manually drawing? For example, an external map service may provide maps of river networks, point sources of emissions, or areas in danger of seasonal fires. In this scenario, you can add Graphic items to the map with the QueryTask module, which queries data in a map service. This allows you to ask the map data questions, and then you can do something with the results you’re given—for example, display the answers on a map.