concept forecast in category churn

This is an excerpt from Manning's book Fighting Churn with Data.
Most readers should start at the beginning and read parts 1 and 2. If after learning and applying those techniques you need to make forecasts or find lookalike customers then continue to part 3. If you are in a situation where you are already using advanced analytics then you may be able to skip part 1 and start in part 2 and/or 3. For these purposes, being advanced in analytics mans you already have a good set of customer metrics and are able to identify and measure churned customers - if you are not already doing those then start in Part 1.
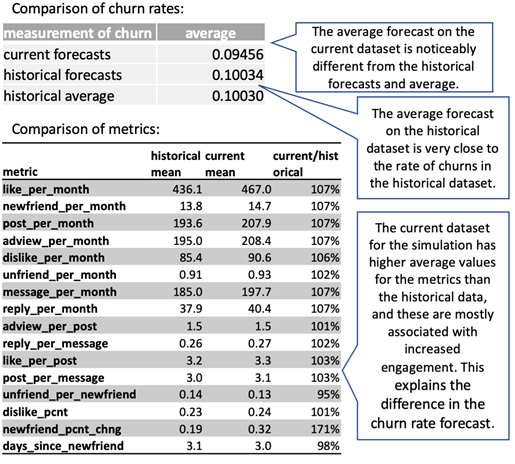
Figure 8.15 Calibration and forecast drift illustration
The fact that standard accuracy is dominated by non-churn is simply because churns are rare, so true-positives cannot possibly have much impact on the numerator in the standard accuracy ratio. As a result, the measurement doesn't always do a good job of showing whether forecasts are appropriate or not. To make this point, note that there is an easy way to get a high standard accuracy measurement, as illustrated in figure 9.2: If you were to simply predict that no customers churn (all customers in the non-churn group), then you would have true-negative predictions for the majority. If you have all of the true-negatives correctly assigned then the resulting accuracy is the retention rate and you would have a high standard accuracy measurement without having predicted anything about the churn.