concept interpolation in category d3

This is an excerpt from Manning's book D3.js in Action, Second Edition: Data visualization with JavaScript.
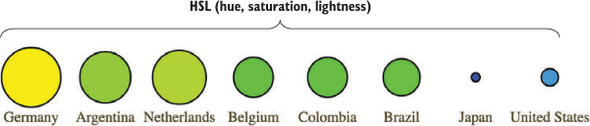
Interpolation modifies the representation of data. Experiment with this drawing code to see how the different interpolation settings show different information than other interpolators. Data can be visualized in different ways, all correct from a programming perspective, and it’s up to you to make sure the information you’re visualizing reflects the actual phenomena.
Data visualization deals with the visual representation of statistical principles, which means it’s subject to all the dangers of the misuse of statistics. The interpolation of lines is particularly vulnerable to misuse, because it changes a clunky-looking line into a smooth, “natural” line.