concept pattern in category dask
This is an excerpt from Manning's book Data Science with Python and Dask.
The first thing that sets Dask apart from the competition is that it is written and implemented entirely in Python, and its collection APIs natively scale NumPy, Pandas, and scikit-learn. This doesn’t mean that Dask merely mirrors common operations and patterns that NumPy and Pandas users will find familiar; it means that the underlying objects used by Dask are corresponding objects from each respective library. A Dask DataFrame is made up of many smaller Pandas DataFrames, a Dask Array is made up of many smaller NumPy Arrays, and so forth. Each of the smaller underlying objects, called chunks or partitions, can be shipped from machine to machine within a cluster, or queued up and worked on one piece at a time locally. We will cover this process much more in depth later, but the approach of breaking up medium and large datasets into smaller pieces and managing the parallel execution of functions over those pieces is fundamentally how Dask is able to gracefully handle datasets that would be too large to work with otherwise. The practical result of using these objects to underpin Dask’s distributed collections is that many of the functions, attributes, and methods that Pandas and NumPy users will already be familiar with are syntactically equivalent in Dask. This design choice makes transitioning from working with small datasets to medium and large datasets very easy for experienced Pandas, NumPy, and scikit-learn users. Rather than learning new syntax, transitioning data scientists can focus on the most important aspect of learning about scalable computing: writing code that’s robust, performant, and optimized for parallelism. Fortunately, Dask does a lot of the heavy lifting for common use cases, but throughout the book we’ll examine some best practices and pitfalls that will enable you to use Dask to its fullest extent.
In the previous chapter, we performed some basic analyses of the NYC Parking Ticket data by looking at descriptive statistics and some other numerical properties of the dataset. While describing data numerically is precise, the results can be somewhat difficult to interpret and are generally not intuitive. On the other hand, we humans are very good at detecting and understanding patterns in visual information. Incorporating visualization into our analyses can help us better understand the general makeup of our dataset as well as how different variables interact with one another.
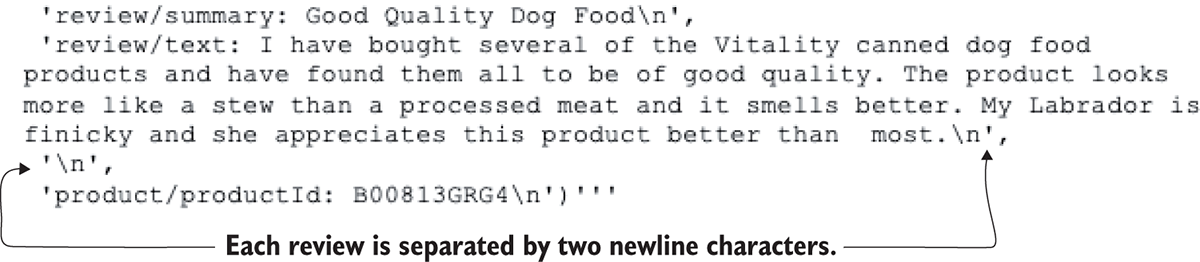
Figure 9.3 A pattern enables us to split the text into individual reviews.