concept air quality in category data
appears as: air quality, ir quality

This is an excerpt from Manning's book Data Wrangling with JavaScript.
Figure 12.3 The data for this chapter. We’re interested in the PM10 column for monitoring air quality.
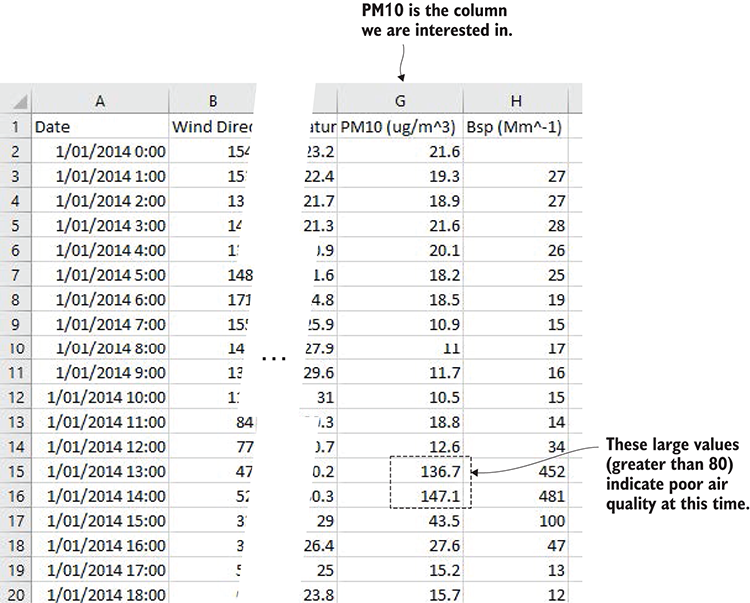
Notice the larger values for PM10 that are highlighted in figure 12.3. At these times, we’ve got potentially problematic levels of atmospheric particulate matter. On the chart in figure 12.4, we can easily see this spike between 12 p.m. and 3 p.m.—this is when air quality is worse than normal. Figure 12.4 also shows the chart that we’ll make in this chapter.