concept label in category gnuplot

This is an excerpt from Manning's book Gnuplot in Action.
Did you notice that figure 1.3 and figure 1.4 contain more than just data? Both axes are now labelled! Details such as labels and other helpful decorations often make the difference between a mediocre and a high-quality graph, because they provide the observer with the necessary context to fully understand the graph.
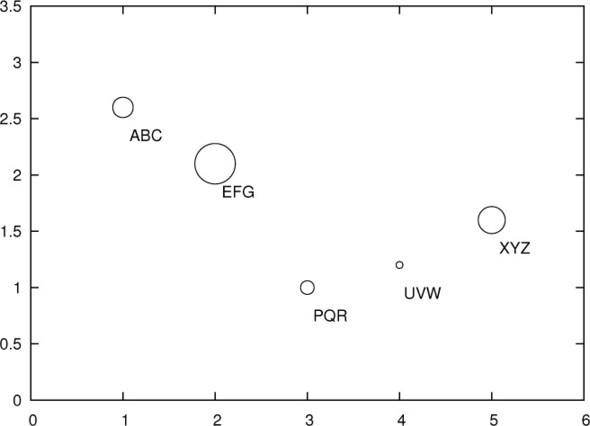
Figure 6.9. Encoding additional information through symbol size or textual labels: pointsize variable and with labels. The corresponding data file is shown in listing 6.1.
But you can do much more to make a graph useful and informative: you can add arrows and annotations on the graph to point out and explain interesting features. You may also want to provide special tic marks and labels to make quantitative information stand out more. Or you can change the size and shape of the entire graph to accommodate a specific data set.
Listing 10.2. Commands for figure 10.3 (file: enhanced-mode.gp)
set label 1 "{/OpenSymbol f}(x) = e^{-x^2/2} / √2{/OpenSymbol π}" at 1.2,.25 set label 2 "{/OpenSymbol F}(x) = @_{-8}^x &{i} {/OpenSymbol f}(t) dt" at 1.2,0.8 set label 3 "{/:Bold*2 Big and Bold}" at -2.5,0.6 set key top left title "{/:Bold Legend}" set xtics ( "{/OpenSymbol p}/2" pi/2, "0" 0, "-{/OpenSymbol p}/2" -pi/2 ) plot [-3:3] exp(-0.5*x**2)/sqrt(2*pi) t "{/OpenSymbol f}(x)", norm(x) t "{/OpenSymbol F}(x)"

This is an excerpt from Manning's book Gnuplot in Action: Understanding Data with Graphs.
Did you notice that figure 1.3 and figure 1.4 contain more than just data? Both axes are now labelled! Details such as labels and other helpful decorations often make the difference between a mediocre and a high-quality graph, because they provide the observer with the necessary context to fully understand the graph.
Figure 5.14. Encoding additional information through symbol size or the use of textual labels: pointsize variable and with labels. The corresponding data file is shown in listing 5.2.

But we can do much more to make a graph useful and informative: we can add arrows and annotations on the graph to point out and explain interesting features. We may also want to provide special tic marks and labels to make quantitative information stand out more. Or we may need to change the overall size and shape of the entire graph to accommodate a specific data set.