concept movie in category graphx

This is an excerpt from Manning's book Spark GraphX in Action.
The graphs we have looked at so far have captured links between pages; there is either a link or no link. We can make the graphs richer if we have more information about the connection. A typical example would be ratings information. When you give a 5-star rating to a movie on Netflix, not only do you create a connection between yourself and the movie, you also assign a value to that connection.
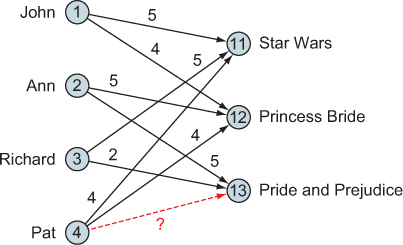
Assume that we’re tasked with developing a recommender system that recommends movies, and we have past ratings by users who rate movies they’ve watched on a scale from one to five stars. This can be expressed as a bipartite graph, as shown in figure 7.2, where the vertices on the left are the users, the vertices on the right are the movies, and the edges are the ratings. The dashed edge represents a prediction to be made: what rating would Pat give Pride and Prejudice?