concept Instruments in category ios

This is an excerpt from Manning's book Objective-C Fundamentals.
In the rare case that method sending causes an undue performance hit, it’s possible to bypass several aspects of Objective-C’s dynamism. Bypassing should be performed, however, only after analysis using tools such as Instruments.
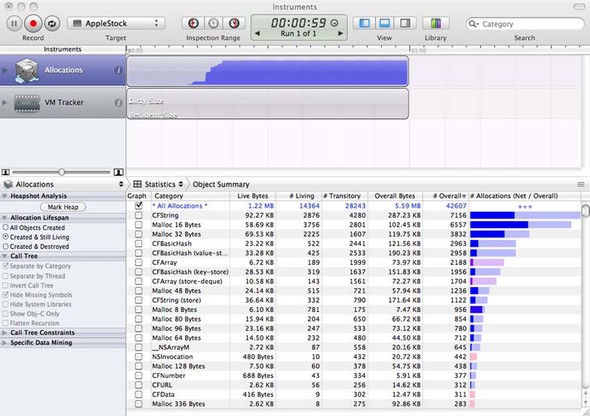
While Instruments is monitoring the execution of your application, select the Allocations instrument and scroll around the UITableView. Notice that the line labeled All Allocations (representing all memory allocated in the application) keeps indicating that memory is being consumed. You can confirm this by looking at the column labeled # Living, which indicates the total number of objects currently alive in the application. As you continue to scroll around the UITableView, this number steadily increases at a rate that seems proportional to your scrolling. Notice also that the graph labeled Leaks indicates that leaks have been detected and a steadily increasing blue line indicates how much memory is being leaked.
Stop the application by clicking the Stop button in the Instruments toolbar, and you’ll get a list of all the objects in memory that Instruments has detected as being potentially leaked. It appears your application has leaked a number of string objects.

This is an excerpt from Manning's book iOS 4 in Action: Developing iPhone and iPad Apps.
Xcode, Instruments, and Dashcode were all available as part of the development library of Mac OS X before the iPhone came along. Many of these programs are expanded and revised for use on the iPhone, so we’ve opted to briefly summarize them all, in decreasing order of importance to an SDK developer:
In the previous section, you learned how to use the Debugger under Xcode; but certain memory-allocation bugs are hard to discover with the Debugger, and that’s when Instruments is useful. Under Xcode, navigate to Product > Profile (or click the Run button to bring up the drop-down menu, and then select Profile). Selecting Profile will launch Instruments with the application running on the iOS Simulator, as shown in figure 4.13.
Figure 4.14. Use Allocations under Instruments to analyze the memory allocations during application runtime.
Leaks is another trace tool under Instruments, which comes in handy for memory-related bugs. Select Leaks when Instruments launches under the template prompt window. Leaks runs with a sample of every 10 seconds by default; you can manually check for leaks by clicking the Check for Leaks Now button on the bottom-left control panel (see figure 4.15).