concept likelihood in category Keras

This is an excerpt from Manning's book Probabilistic Deep Learning: With Python, Keras and TensorFlow Probability.
Abbreviation / Term
Definition / Meaning
Aleatoric Uncertainty
Data inherent uncertainty which cannot be further reduced. For example, you can’t tell on which side a coin will land.
API
Application interface
Bayesian Mantra
The posterior is proportional to the likelihood times the prior.
BNN
Bayesian Neural Networks, NN with their weights being replaced by distributions. Solved with VI or MC-Dropout.
Bayesian Probabilistic Models
Probabilistic models that can state their epistemic uncertainty by characterizing all parameters of a distribution.
Bayesian View of Statistics
In the Bayesian view on statistics, the parameters
are not fixed but follow a distribution.
Bayesian Theorem
, this famous formula tells how to invert a conditional probability
Bayesian learning
, this formula tells you how to determine the posterior
from the likelihood
, the prior
and the marginal likelihood (aka evidence)
. It is a special form of the Bayesian theorem with
and
, with
the data.
Backpropagation
Method to efficiently calculate the gradients of the loss function w.r.t. the weights of a NN.
Bijectors
TFP package for invertible (bijective) functions needed for NF.
CIFAR-10
A popular benchmark data containing 60,000 32x32 color images of 10 classes.
CNN
Convolutional Neural Networks, NN especially suited for vision applications.
Computational Graph
A graph which encodes all calculations in a NN.
CPD
Conditional Probability Distribution. We also sloppily call the density
of an outcome y (e.g. the age of a person) given some input x (e.g. the image of a person) a CPD.
Cross Entropy
Another name for NLL in the case of classification tasks.
Deterministic Model
Non-Probabilistic Model, returning no distribution for the outcome but only one best guess.
Dropout
Dropout refers to randomly deleting nodes in a NN. Dropout during training yields typically NNs that show reduced overfitting. Performing Dropout also during test time (see MC dropout) is interpreted as an approximation of a BNN.
DL
Deep Learning
Extrapolation
Leaving the range of data with which a model was trained.
Epistemic Uncertainty
Uncertainty of the model caused by the uncertainty about the model parameters, which can in principle be reduced by providing more data.
fcNN
Fully connected neural networks.
GLOW
A certain CNN network based on NF which generates realistic looking faces.
ImageNet
A famous data set with 1 Million labeled images of 1000 classes.
Jacobian matrix
The Jacobian matrix of a multidimensional function or transformation in several variables is the matrix of all its first-order partial derivatives.
Jacobian Determinant
The determinant of the Jacobian matrix. It is used to calculate the change in volume happening in transformations, needed for NF.
Keras
Keras is a high-level neural networks API which we use in this book in conjunction with TensorFlow.
KL-Divergence
A kind measure for the distance between two PDFs.
Likelihood
The probability
that sampling from a density specified by a parameter value
Loss Function
A function which quantifies the badness of a model and which is optimized during the training of a DL model.
MAE
Mean Absolute Error. The MAE is a performance measure, which is computed as the mean of absolute values of the residuals. It is not sufficient to quantify the performance of probabilistic models (here the NLL should be used as performance measure).
MaxLike
Maximum Likelihood
MaxLike learning
A likelihood based method to determine the parameter values
ML
Machine Learning
MC dropout
Monte Carlo Dropout refers to dropout during test time. A method that is interpreted as approximation to a BNN.
MNIST
More correctly the MNIST database of handwritten digits. A dataset of 60,000 28x28 greyscaled 10 classes (the digits 0-9).
MSE
Mean Squared Error. The MSE is a performance measure, which is computed as the average of the squared residuals. It is not sufficient to quantify the performance of For probabilistic models (here the NLL should be used as a performance measure).
NF
Normalizing Flow. NF is a NN based method to fit complex probability distributions.
NLL
Negative Log-Likelihood. The NLL is used as a loss function when fitting probabilistic models.
The NLL on the validation set is the optimal measure to quantify the prediction performance of a probabilistic model.NN
Neural Network
Observed outcome
The observed outcome or “
-value” which is measured for a certain instance i. In a probabilistic model, we aim to predict a CPD for y based on some features that characterize the instance i. Sometimes
Probability density function. The PDF is also sometimes referred to as probability density distribution. See CPD for a conditional version.
PixelCNN++
A certain CNN model capturing the probability distribution of pixel values. The “++ version” uses advanced CPDs for performance.
Posterior
The distribution
of a parameter
Posterior predictive distribution
The CPD
given the data D which results from a Bayesian probabilistic model.
Prediction Interval
Interval in which a certain fraction, typically 95%, of all data are expected.
Prior
The distribution
which is assigned to a model parameter
Probabilistic Model
A model returning a distribution for the outcome.
Residuals
Differences between the the observed value
and the deterministic model output
(the expected value of the outcome).
RMSE
Root Mean Squared Error, the square root of the MSE.
RealNVP
A specific NF model called Real Non-Volume Preserving.
softmax
An activation function enforcing that the output of the neural network sums up to 1 and can be interpreted as a probability.
softplus
An activation function, which after it’s application ensures positive values
SGD
Stochastic Gradient Descent
Tensor
Multidimensional array, the main data structure in deep learning
TF
TensorFlow is a low-level library which is used in this book for DL.
The big lie of DL
The assumption P(Train)=P(Test), that the test data stems from the same distributions as the training data. In many DL / ML applications, this is assumed but often not true.
TFP
TensorFlow Probability add-on to TF facilitating probabilistic modeling of DL.
VGG16
A traditional CNN with a specific architecture that was on second rank of the imageNet competition in 2014. It is often used with weights that resulted after training on the imageNet data to extract feature from an image.
VI
Variational Inference is a method for which it can be shown that it yields an approximation to a BNN.
w.r.t.
with respect to
WaveNet
A specific NN model for text to speech.
ZIP
Zero Inflated Poisson a special distribution for count data taking care of an excess of the value 0.
You take the parameter value for which the likelihood to get the observed data is maximal as the optimal parameter value - also called Maximum Likelihood (ML) estimator.
- here the ML estimator is that the die has one side with a dollar sign.
You can use the maximum likelihood principle to tune the two weights
of the NN used to perform linear regression (see figure 4.12). But what is the likelihood of the observed data? In regression it is just a little bit harder to answer this question than in classification. Remember in classification you can determine the probability or likelihood for each observed value from the probability distribution with the parameters
. These parameters are controlled by a neural network (see figure 4.12). In regression the observed value
is continuous. Here you need to work with a Normal distribution (other distributions beside the Normal are also sometimes adequate and we deal with them later in chapter 5). But now we stick to the normal distribution, it has two parameters
and
. For start, we leave the parameter
) and let the NN control only the parameter
The subscript
in
reminds us that this parameter depends on x. It is determined by the network and thus
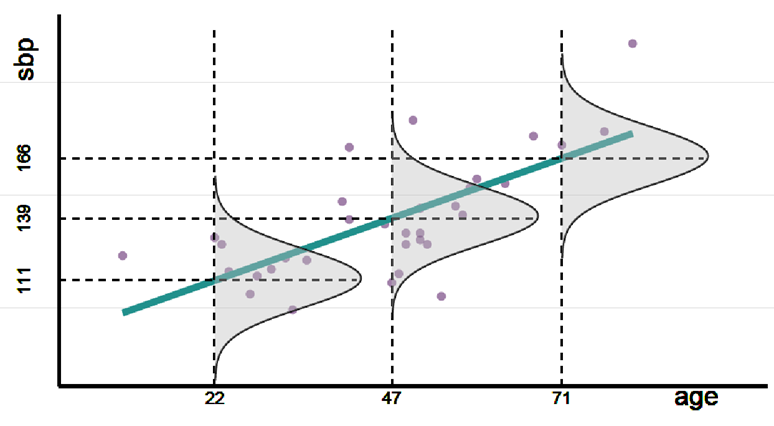
on x. In figure 4.15 this is shown with a bold line. Older women have on average a higher blood pressure. The weights (a,b) themself are determined (fitted) to maximize the likelihood of the data. What is the likelihood of the data? We start with a single data point
. Inspect for example the data point of the 22 year old woman who has a sbp value of 131. For that age the network predicts an average value of
is fixed.
Figure 4.15 Scatterplot and regression model for the blood pressure example: The dots are the measured data points, the straight line is the linear model, the bell-shaped curves are the conditional probability distributions of the outcome Y conditioned on the observed value x. The length of the horizontal red bar indicates likelihood for the observed sbp of 131 for a 22 year old woman.