concept datum in category pyspark

This is an excerpt from Manning's book Data Analysis with Python and PySpark.
According to pretty much every news outlet, data is everything, everywhere. It’s the new oil, the new electricity, the new gold, plutonium, even bacon! We call it powerful, intangible, precious, dangerous. I prefer calling it useful in capable hands. After all, for a computer, any piece of data is a collection of zeroes and ones, and it is our responsibility, as users, to make sense of how it translates to something useful.
Just like oil, electricity, gold, plutonium and bacon (especially bacon!), our appetite for data is growing. So much, in fact, that computers aren’t following. Data is growing in size and complexity, yet consumer hardware has been stalling a little. RAM is hovering for most laptops at around 8 to 16 GB, and SSD are getting prohibitively expensive past a few terabytes. Is the solution for the burgeoning data analyst to triple-mortgage his life to afford top of the line hardware to tackle Big Data problems?
The remainder is what I call invisible work: ingesting the data, cleaning it, figuring its meaning and shaping it into a usable form. If you look at your simple steps, Step 1 to 3 can be considered invisible work: we’re ingesting data and getting it ready for the counting process. Step 4 and 5 are really the visible ones that are answering our question (one could argue that only Step 5 is performing visible work, but let’s not split hairs here). Steps 1 to 3 are there because the data requires processing to be usable for our problem. They aren’t core to our problem, but we can’t do without them.
When building your own project, this will be the part that will be the most time consuming and you might be tempted (or pressured!) to skimp on it. Always keep in mind that the data you ingest and process is the raw material of your programs, and that feeding it garbage will yield, well, garbage.
We get a data frame, as expected! If you input your data frame, conveniently named
book, into the shell, you see that PySpark doesn’t actually output any data to the screen. Instead, it prints the schema, which is the name of the columns and their type. In PySpark’s world, each column has a type: it represents how the value is represented by Spark’s engine. By having the type attached to each column, you can know instantly what operations you can do on a the data. With this information, you won’t inadvertently try to add an integer to a string: PySpark won’t let you add 1 to "blue". Here, we have one column, namedvalue, composed of astring. A quick graphical representation of our data frame would look like figure 2.3. Besides being a helpful reminder of the content of the data frame, types are integral to how Spark processes data quickly and accurately. We will explore the subject extensively in Chapter 5.Figure 2.3. A high-level schema of a our
bookdata frame, containing avaluestring column. We can see the name of the column, its type, and a small snippet of the data.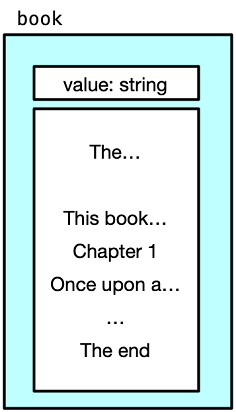
In [*]: print(spark.read.__doc__)

    Interface used to load a :class:`DataFrame` from external storage systems
    (e.g. file systems, key-value stores, etc). Use :func:`spark.read`
    to access this.

    .. versionadded:: 1.4


In [*]: spark.read?
Type:        property
String form: <property object at 0x1159a0958>
Docstring:
Returns a :class:`DataFrameReader` that can be used to read data
in as a :class:`DataFrame`.

:return: :class:`DataFrameReader`

.. versionadded:: 2.0