concept line chart in category python
appears as: line chart

This is an excerpt from Manning's book Math for Programmers: 3D graphics, machine learning, and simulations with Python.
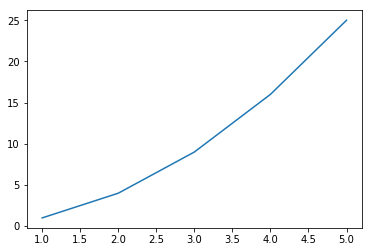
If we use the Matplotlib plt.plot function instead of the plt.scatter function, our points are connected with lines rather than being marked as dots. This is sometimes called a line chart. For example,
plt.plot(x_values,y_values)Figure B.3: Creating a line chart with the Matplotlib plt.plot function