concept task in category software development

This is an excerpt from Manning's book Agile Metrics in Action: How to measure and improve team performance.
If you want to see how productive your team is, you can start by finding out how many tasks are being completed. The problem with measuring the number of tasks is that a handful of very difficult tasks could be much more work than many menial ones. To balance that possibility you can add the amount of effort that went into completing those tasks, measured in figure 1.12 with story points.

Cumulative flow shows how much work aggregated by type is allocated to your team over time. The cumulative flow diagram is typically used for identifying bottlenecks in the process by visually representing when a type of task is increasing faster than the others. In figure 3.4 you see an example cumulative flow diagram where a team is completing hardly any work and suddenly their to-do list jumps off the charts.
Figure 3.4. An example cumulative flow diagram showing a team getting asked to do a lot more than they have been able to accomplish historically
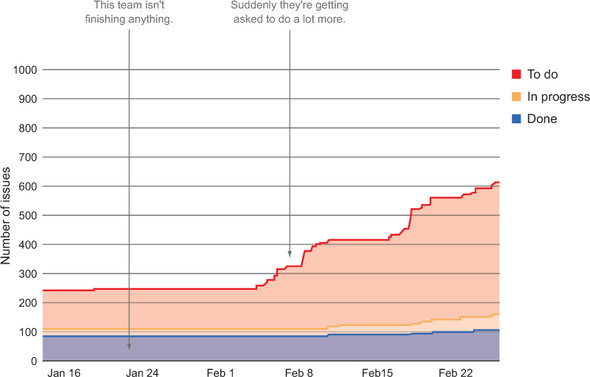
As with other charts, this tells only a part of the picture. It’s possible that tasks were simply too big and the team started breaking them down into smaller chunks. It’s also possible that this team is struggling to complete work and they end up getting more work piled on as an unrealistic task.
Cumulative flow can be useful when you use the correct task types for your work. If you have tasks for integration and you see that part of your graph starts to get fat, you know there’s a bottleneck somewhere in your integration.
Done means a task is complete. Despite the seemingly simple definition, done can be a tough thing for the business and the agile team to figure out and agree on. Because the data in your PTS associates time with tasks, the criteria for which tasks are complete are key because they determine when to put an end time on a task. Often, done means that the task in question is ready to deploy to your consumers. If you group lots of changes into deployments and have a separate process for delivering code, then measuring the time it takes to get ready for a deployment cycle makes sense. If you move to a model where you’re continuously deploying changes to your consumers, it’s better to categorize tasks as done after they’ve been deployed. Whatever your deployment methodologies are, here are some things to consider when defining done for your team’s tasks:
Recidivism = Backwards Tasks / (Forward Tasks + Backwards Tasks)

This is an excerpt from Manning's book Agile ALM: Lightweight tools and Agile strategies.
This task-based build process overlaps different phases and roles. The developer codes according to tasks that are tracked and assigned. Part of the application is a bouquet of languages that are either company assets developed with commonly used, mainstream programming languages or targeted languages chosen to solve a specific programming task. For testing, Groovy and Scala are used, and all the tests are integrated into a seamless infrastructure without any cross-media conversations or friction losses.
Traditionally, work items (or tasks) are spread across artifact types and tools. Tasks are an abstraction level for coping with the general information overload and the challenges of parsing information from many different sources. A task is a fine-grained, measurable unit of work, extracted from a broader scope, like a use case or a feature. Leffingwell states “for more detailed tracking of the activities involved in delivering stories, teams typically decompose stories into tasks that must be accomplished by individual team members in order to complete the story.”[1]
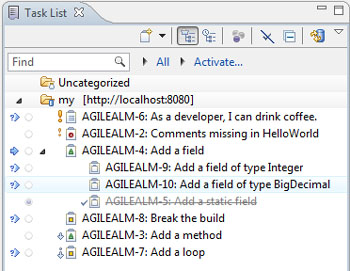
Mylyn is an Eclipse-based task framework. It can integrate with ticket and bug-tracking tools such as JIRA, Bugzilla, Trac, and Mantis. After installing Mylyn with the appropriate ticket system connector for JIRA, and configuring it to connect to your task repository by providing the URL and credentials to login, an additional view is added to Eclipse, showing all tasks matching your search criteria, as shown in figure 4.5. Once your tasks are integrated, Mylyn monitors your work activities and synchronizes with the ticket system automatically. You can reference parts of the sources you’re working on in Eclipse as the context of a task. This context can be attached to the task or even posted as an attachment to the ticket.
Figure 4.5. Mylyn adds a task-based view in Eclipse. In the Eclipse task view, important information about the tasks (such as issue type, status and priorities) are shown directly, but double-clicking will open the complete ticket in your Eclipse editor. Tickets can be grouped by relationships of subtasks. In the left area, incoming and outgoing changes made by you or other developers are identified with icons. Unread tickets—tickets that haven’t been opened yet—are identified with a question mark.

This is an excerpt from Manning's book Becoming Agile ...in an imperfect world.
The best architectures, requirements, and designs emerge from self-organizing teams. In traditional software development, analysts write requirements, and architects lay out the architecture of the system. Then the requirements and architectures are communicated to the team in a document. In the agile world, we encourage teams to self-organize. True self-organization involves giving the whole team the task and asking them, as a team, to complete the task without specifying who should do what—they’re left to self-organize. It will naturally occur that architects will lead the discussion when it comes to architecture, but now everyone is free to challenge them and suggest new ideas that may enhance the architecture the architects would have come up with on their own. This form of collaboration also increases the knowledge transfer within the team.
When an iteration begins, you should understand the work being pursued in detail so the team can understand the tasks and feel confident that they can deliver the features assigned to the iteration. The team will increase their confidence by estimating the identified tasks in hours needed to complete the work, and they will compare the estimates to how much capacity they have in hours available for the iteration.
We cannot prescribe one perfect method for breaking down your features. You may be able to understand the required tasks through team discussion, or you may find that you need to create wireframes or mockups to understand the work that will be required. Some teams can effectively identify tasks by creating use cases for the feature cards and envisioning the system needed to support the use cases.
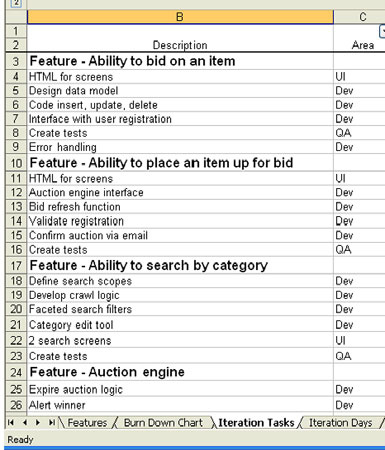
Figure 18.1. Acme Media’s backlog of work for iteration 1. In a perfect world, team members grab a task and begin working. In Acme Media’s world, the team is constrained by specializations, and some tasks can be completed only by certain team members or groups. Acme Media will cross-train, but it will take time for the team to mature to a point of no specializations.