Precision is the numerical detail a representation can preserve, reflected in the spacing between representable values. In model inference, extra precision can increase memory traffic and energy costs without necessarily improving the result. The useful precision depends on both the value distribution and the representation’s range. section 1.3.1 section 8.2.1
Floating point uses a mantissa for significant digits and an exponent to scale them. Its representable values are more closely spaced at small magnitudes and farther apart at large magnitudes. Fixed point instead uses a single, uniformly spaced grid. In a fixed-width format, allocating more bits to the integer part extends the range but leaves fewer bits for fractional detail. section 1.3.1 section 2.1
An 8-bit fixed-point grid
Q3.4 uses one sign bit, three integer bits, and four fractional bits. Its step size is 1/16, or 0.0625; its range is −8.0 to 7.9375. The pattern 0 001 1000 represents 1.5. A value beyond the range can saturate, while a value smaller than the grid can round to zero. section 2.1
Figure 2.3 The range-versus-precision tradeoff in Q-format. For a fixed 8-bit container, every bit allocated to the integer part doubles the representable range but halves the precision (step size). Moving the binary point left (more fractional bits) gives finer resolution at the cost of a narrower range; moving it right does the reverse. There is no free lunch: the total information capacity is fixed by the bit-width.
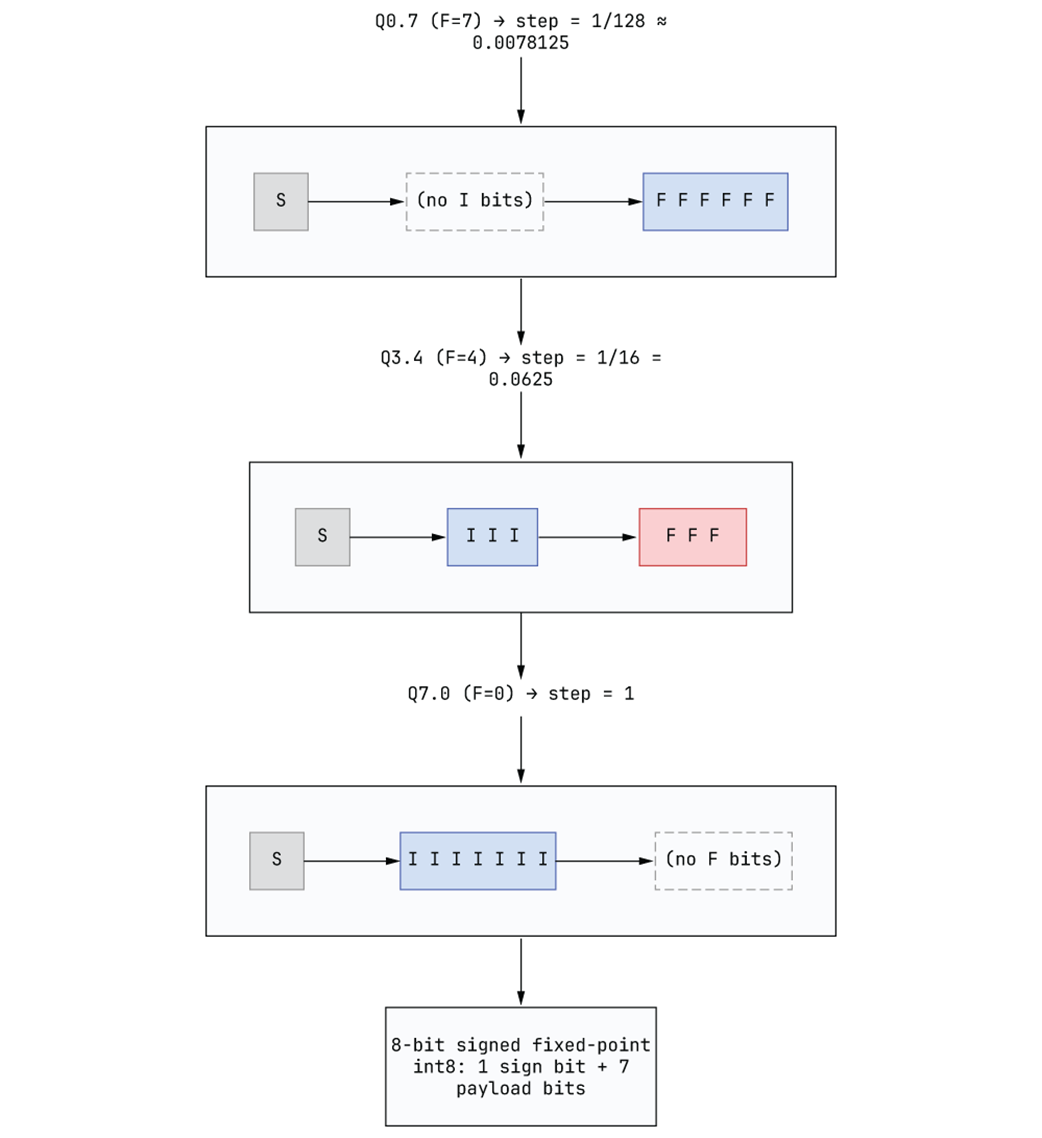
The diagram shows how moving the binary point trades range for resolution within an 8-bit container. section 2.1
Calibrate fixed-point formats against measured activation ranges: too little range causes saturation, while too little resolution can erase small values. Format choice also depends on distribution. In the illustrated comparison over [0, 0.5], E4M3 has 49 representable values versus 32 for scaled symmetric INT8. Denser near-zero coverage can reduce error for tensors concentrated there; uniformly distributed values favor INT8 in this comparison. section 2.1 section 8.2.1
Validate the deployment as well as the numerical choice. Check whether the model actually runs quantized rather than falling back to full precision, and measure the latency the user experiences under stated conditions. section 12.4