An aggregate metric summarizes repeated individual measurements into one value for a decision. In the common case, it is their mean: measure execution cost many times on each exchange, average each set, and prefer the lower average. Individual measurements may also be called observations or samples. section 2.2.1
Aggregation addresses measurement variation. A single observed cost can lie far from the unknown expected cost, whereas averages over repeated measurements are typically closer. Increasing the number of individual measurements narrows the distribution of possible aggregate values; the estimated standard error is sd_1 / √N, where sd_1 is the individual-measurement standard deviation and N is the replication count. section 2.2.1 section 2.3.2
Figure 2.3 Histogram of 1,000 aggregate measurements of ASDAQ cost overlaid on histogram of 1,000 individual measurements. Notice that the aggregate measurement histogram is narrower.
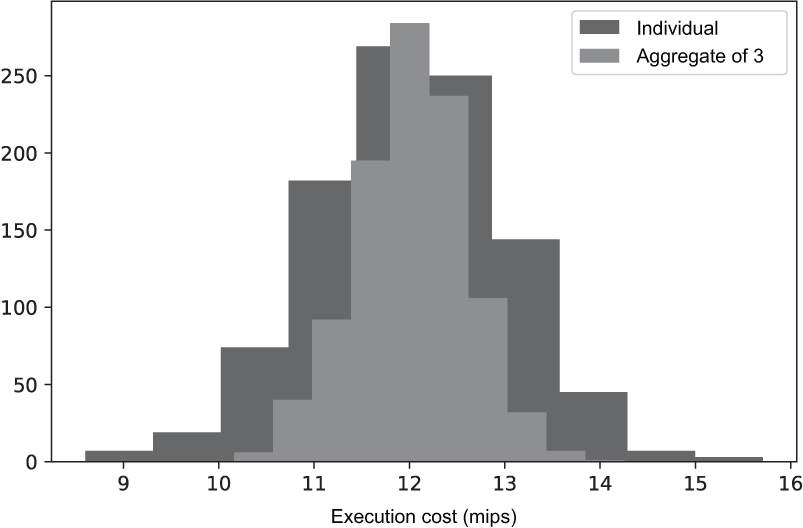
The overlaid histograms make the central trade-off visible: aggregates vary less than individual measurements, and larger aggregates become still more concentrated. section 2.2.1
Comparing execution costs
Take 300 cost measurements per exchange and compute each mean. One run estimates ASDAQ at 12.0003 mips and BYSE at 10.0511 mips, favoring BYSE. The means alone are not certainty: compare their difference, delta = agg_byse − agg_asdaq, with its combined standard error, then use the resulting z score to assess statistical significance. section 2.2.1 section 2.3.1
Use aggregate metrics with an explicit experimental plan:
- Choose replication count from the practically significant effect and expected individual-measurement variability; power analysis increases the required count to limit false negatives. section 2.3.2
- Randomize assignment while collecting measurements so exchange or parameter selection does not introduce bias. section 2.3.3
- Check both practical magnitude and statistical significance before changing production routing; a significant result still carries a stated false-positive risk. section 2.3.3
- Count representative units, not only total events: many items from few users or sessions can leave an aggregate vulnerable to small-sample bias. section 8.4.2
Aggregation also supports parameter optimization. Measure a business metric repeatedly at selected threshold values, retain each mean and its standard error, then interpolate between the measured points. This spends many individual measurements to make each estimate precise while limiting the more expensive number of parameter settings—or aggregate measurements—needed for the search. section 4.1.2 section 4.2.1
