Anscombe’s quartet contains four paired data sets with different joint properties but identical-looking summary values: mean xₙ = 9, mean yₙ = 7.5, and Pearson correlation = 0.816. Plotting the data reveals relationships that summary statistics conceal. section 6.1.3
EDA checkpoint
Add a visualization ticket before modeling: plot the full data set, inspect how points relate, and compare the visible distributions with the reported summaries. section 6.1.3
Figure 6.1 Anscombe’s Quartet. Anscombe.svg: Schutz (label using subscripts): Avenue, CC BY-SA 3.0 (https://creativecommons.org/licenses/by-sa/3.0), via Wikimedia Commons
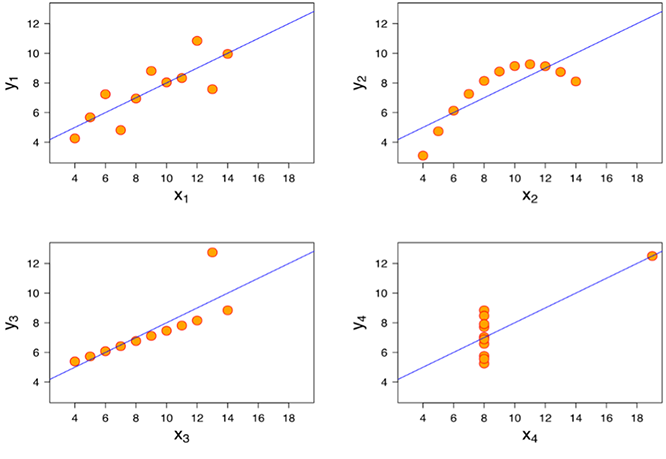
Use the quartet figure to compare four plots whose shared summaries obscure their different distributions and relationships. section 6.1.3
