liveBook · Manning

Attention plot

As explained in Machine Learning System Design

An attention plot is a visualization of attention activations between elements of an input sequence and elements of an output sequence.

An attention plot visualizes activations linking elements of an input sequence to elements of an output sequence. It turns a model assumption into a visible training diagnostic. section 9.2.2

Checking alignment in voice synthesis

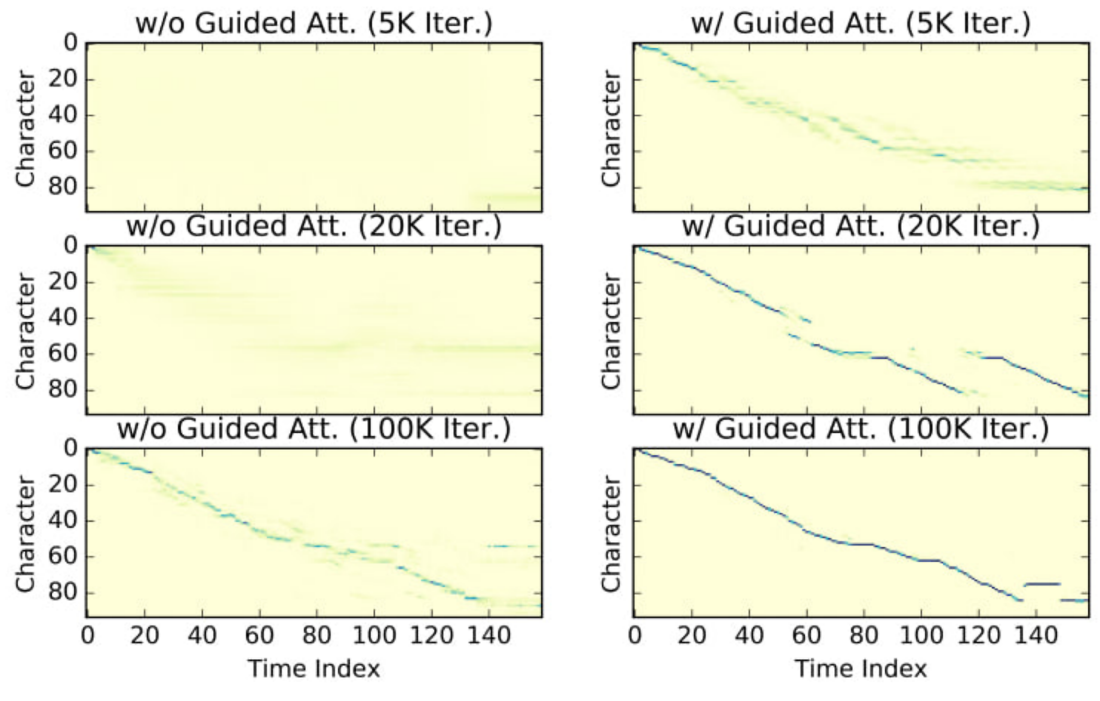
A banking application team builds a voice assistant and assumes characters will align linearly with audio over time. The plot places audio frames on the x-axis and characters on the y-axis. A nearly diagonal pattern supports the assumption; substantial deviation signals a problem. Guided attention addresses this by penalizing departures from the diagonal with an auxiliary loss. This differs from machine translation, where attention resolves alignments across languages with different syntax or token ordering. section 9.2.2

Figure 9.12 Attention plot evolution through training without (left) and with (right) guided attention loss
figure

Compare attention-map evolution during training with and without guided attention loss. section 9.2.2

How Machine Learning System Design covers it

How deep it goes
Explains the axes, diagonal-pattern criterion, and auxiliary-loss response without detailing attention implementation.
Examples
Uses a banking voice assistant, character-to-audio alignment, and training plots with or without guided attention loss.
What you can do after
Diagnose alignment failures by inspecting attention patterns and evaluate whether guided attention improves the expected structure.
How it connects
Ties attention plots to sequence-to-sequence models, text-to-speech, guided attention, and auxiliary loss.

Related concepts

This explainer was generated by Manning's knowledge graph from the text of Machine Learning System Design. The section links point to the parts of the book it draws on.