A clustering algorithm may spend substantial time comparing points without yet knowing the dataset’s rough layout. Canopy clustering makes a quick, coarse grouping first. It places points in spherical regions called canopies; unlike k-means clusters, these regions can overlap, so a point may belong to several. The result can guide a later, more precise algorithm. section 13.1.3 section 13.1.4
Given a distance measure and thresholds T1 > T2:
- Choose a random point still eligible to become a canopy center. section 13.1.3
- Add every dataset point closer than T1 to that center’s canopy. Remove points closer than T2 from the list of *eligible centers*, but keep them in the dataset: they may also belong to another canopy. section 13.1.3
- Repeat until no eligible centers remain. Each center is an existing point, not a computed center of mass; the resulting canopies may overlap. section 13.1.3
Figure 13.2 An example of canopy clustering running on a dataset. The first three sub-figures show the creation of tree canopies, starting from randomly chosen points. Circles filled with a solid color other than the lightest shading are points removed from the list of possible centroids, while pentagons are the centroids of canopies. The solid-color points are removed from the list because they lie within the inner radius (T2) from the centroids (as shown in the first three steps). The last sub-figure shows the clusters created after a few more steps. Note that there are still some lightly shaded points, so at least three more canopies (that will partially overlap the five shown) will be created to include those points.
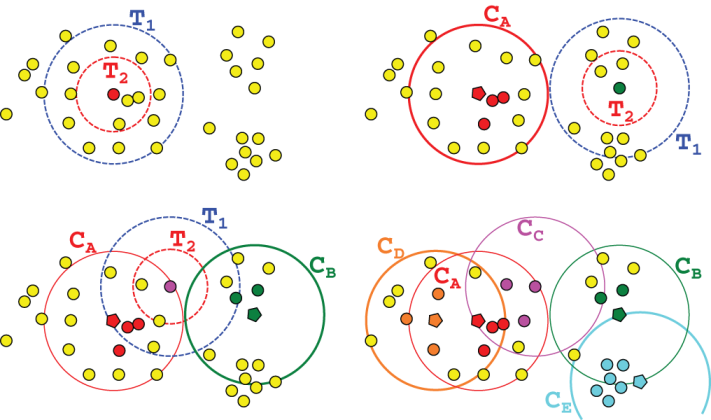
The diagram distinguishes points removed as future centers from points still eligible for selection, and shows how additional canopies can overlap earlier ones. section 13.1.3
For k-means, compute centers of mass for the canopies and use them to initialize centroids instead of choosing all initial centroids at random. Alternatively, draw some initial centroids from each coarse region. Do not treat overlapping canopies as a completed k-means assignment: a point can appear in more than one. Canopy-based initialization can speed convergence. section 13.1.4
For DBSCAN, run clustering within canopy regions to work with areas that may have more uniform density and tune parameters locally. Then reconcile local results. Overlapping canopies can yield overlapping clusters, and even non-overlapping canopies can contain border points close enough to belong to the same DBSCAN cluster. section 13.1.4
A MapReduce version first selects canopy centers independently on data shards, then runs canopy clustering again on those selected centers. The second pass removes centers from different shards that are closer than T2. If full canopy membership is needed, filtering centers creates another problem: points covered by a discarded center may be left uncovered. A separate distributed classification pass can assign points to the retained centers using radius T1 + T2. section 13.3.1 section 13.3.3
The work depends on how many centers are selected: the pseudocode checks dataset points against each selected center, rather than computing k-means centroids repeatedly. A fast approximate distance measure can reduce the cost further at the expense of precision. Thresholds affect the number of canopies, but cannot fix it exactly: random selection can produce different counts across runs, so a requested k-means centroid count may require threshold adjustment. section 13.1.3 section 13.3.2
