Cardinality is the number of distinct values represented by a variable or column. Low-cardinality categorical columns contain a small set of repeated, unordered values; string columns usually contain longer, mostly unique values. section 2.0
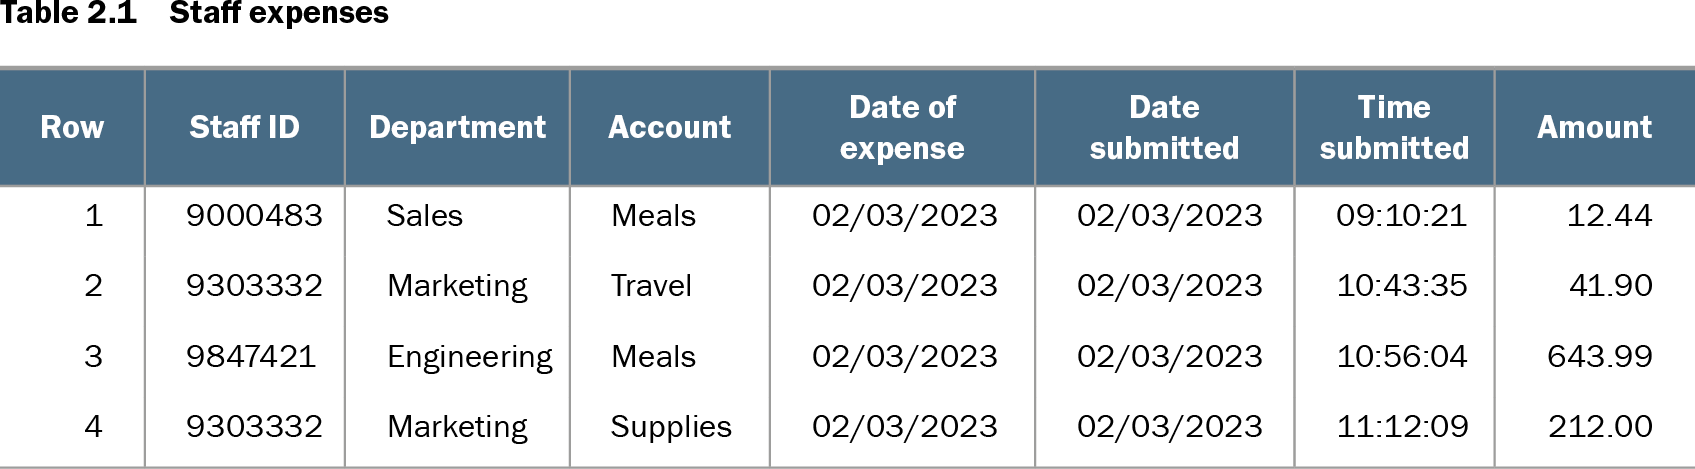
Table 2.1 Staff expenses (view table figure)
| Row |
Staff ID |
Department |
Account |
Date of expense |
Date submitted |
Time submitted |
Amount |
|---|---|---|---|---|---|---|---|
| 1 |
9000483 |
Sales |
Meals |
02/03/2023 |
02/03/2023 |
09:10:21 |
12.44 |
| 2 |
9303332 |
Marketing |
Travel |
02/03/2023 |
02/03/2023 |
10:43:35 |
41.90 |
| 3 |
9847421 |
Engineering |
Meals |
02/03/2023 |
02/03/2023 |
10:56:04 |
643.99 |
| 4 |
9303332 |
Marketing |
Supplies |
02/03/2023 |
02/03/2023 |
11:12:09 |
212.00 |
A staff-expense table illustrates low-cardinality categorical columns such as Department and Account alongside numeric, date, time, and identifier fields. section 2.0
Cardinality changes how rarity and combinations should be interpreted:
- Treat a rare value cautiously: high-cardinality features can contain many uncommon values without producing meaningful outliers. section 2.2
- Expect combinations to become sparse as the number of features and their cardinalities increase; many possible combinations may never occur. section 2.4.1
- Normalize observed value counts against uniform-distribution expectations, the mode, or the median before applying a threshold. section 2.2
Rare values in a categorical feature
With 2,000 rows and 1,000 similarly frequent values, each value occurs about twice; labeling every value below 1% as anomalous would overreport. A normalized rarity score provides a more comparable basis for review. section 2.2