A cartogram deliberately distorts the area or length of geographic objects to encode another variable. Countries may bulge or shrink according to population, while streets may change length according to driving time. section 13.6.6
D3 provides no simple built-in functions for creating cartograms, so a visualization can rely on an external library such as Matt Dzugan’s World Population Cartogram. section 13.6.6
Figure 13.21 Cartogram created by Matt Dzugan where the countries are sized by their population (Source: http://mng.bz/GZd8)
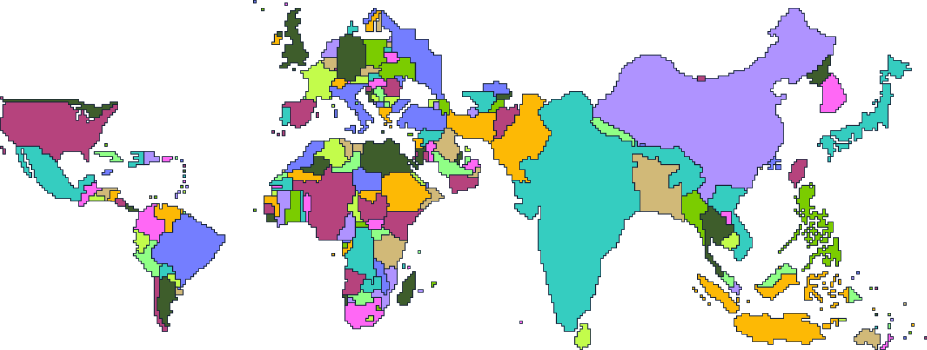
Use the population cartogram to see geographic areas reshaped so their sizes communicate population rather than physical area. section 13.6.6
