A categorical distribution represents uncertainty about one outcome among a finite set of mutually exclusive categories. Each category receives a non-negative probability, and all probabilities must sum to 1. section 1.5
For rainfall, the categories might be no rain, 0.01 inches per hour, and 0.02 inches per hour. A belief such as 80%, 10%, and 10% describes uncertainty about which outcome will occur. section 1.5
Categories do not have to be exact numerical values:
- Use exact values when each possible outcome is represented separately, such as 0.01 or 0.02 inches of rain per hour. section 1.5
- Use numerical ranges when outcomes are grouped, such as 0 to 0.01 inches or 0.01 to 0.02 inches. section 1.5
- Use a categorical distribution for a discretized quantity when rounding or dividing a continuous scale into intervals. section 1.5
A discrete prior for a proportion
Suppose a proportion p can take only the values 0.0, 0.1, 0.2, …, 1.0. A categorical distribution assigns prior probability to each of these eleven possibilities. Equal probabilities express no preference; higher probabilities near 0.5 express a belief that middling values are more likely. section 2.9
Figure 1.2 An example categorical distribution for rainfall rate.
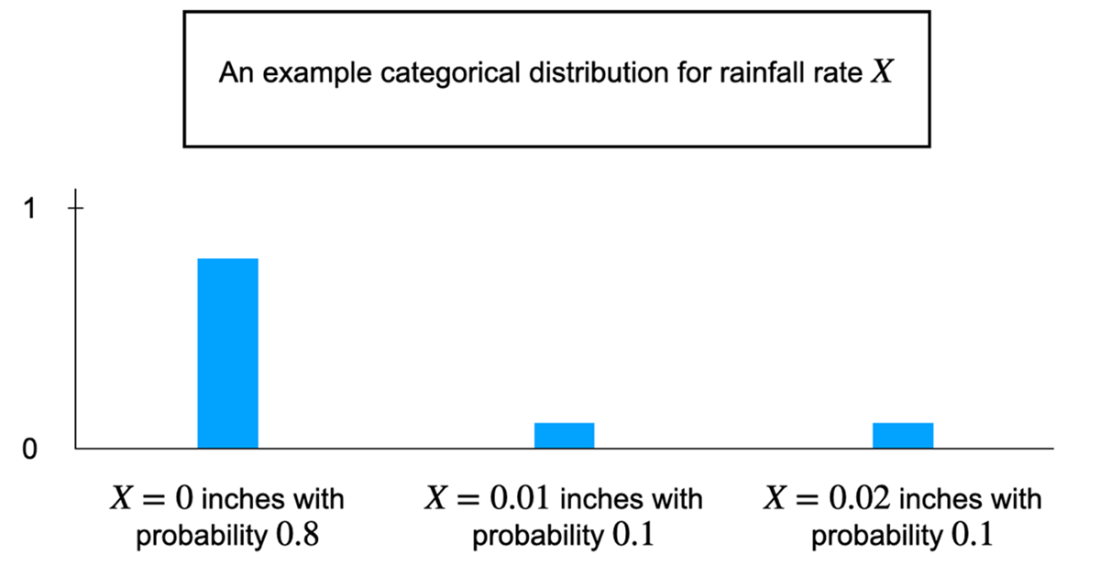
Visualizes a categorical distribution for rainfall rates, making the relative probability assigned to each category easy to compare. section 1.5