Centroid-based clustering groups observations by their distance from cluster centers, called centroids. A smaller distance indicates greater similarity to a cluster. The choice of attributes matters: different attributes can produce different groupings of the same data. section 2.3 section 2.2
Figure 2.4 Centroid-based clustering methods create a centroid for the respective clusters, and the similarity is measured based on the distance from the centroid. In this case, we have five centroids; hence, we have five distinct clusters.
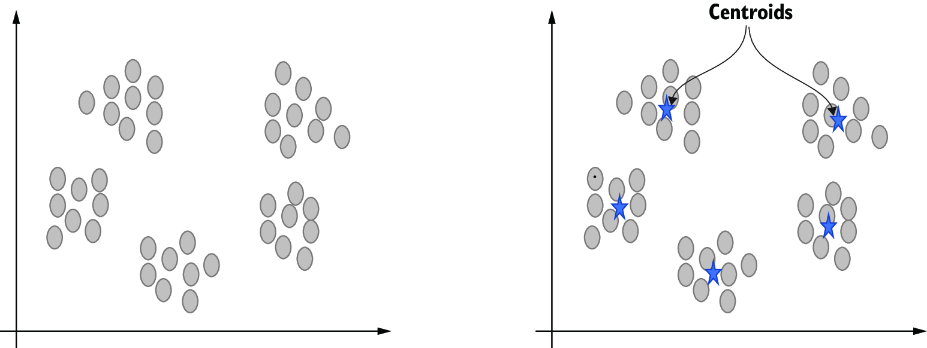
The diagram shows five centroids and five corresponding clusters, making the point-to-center comparison visible. section 2.3
Distance gives the comparison a concrete meaning. Euclidean distance follows the straight line between points; Manhattan distance follows axis-aligned paths; Chebyshev distance takes the largest difference along any coordinate. Because distance defines similarity, the metric chosen affects how observations compare. section 2.3 section 2.2
K-means is a practical centroid-based starting point. Specify the number of clusters, k, and it iteratively assigns points to the nearest center to form nonoverlapping clusters. Its straightforward logic makes it useful as a benchmark before trying other clustering algorithms. section 2.10 section 2.3.5
Cluster vehicle measurements in Python
Load the vehicle CSV with pandas, inspect its shape, columns, class counts, and missing values, then drop the class column and standardize the measurements. Plot the data and compare k values using an elbow plot of average distortion. With k=3, fit scikit-learn’s KMeans, inspect cluster centers and label counts, and plot labeled observations using length, height, and weight. Repeat with different initializations and k values rather than relying on one run. section 2.3.5
Use the resulting labels and plots to judge whether the groups are useful for the problem at hand. If they are not, revisit the attributes, k, and algorithm: density-based and connectivity-based methods define groups differently. section 2.2 section 2.3.5
