A chance node represents an uncertain event that the decision-maker cannot control. Usually drawn as a circle, it branches to possible outcomes labeled with probabilities. Those outcomes must be mutually exclusive and collectively exhaustive, so their probabilities sum to 1. section 7.1.2
Figure 7.1 Decision tree for the treatment decision. The square node represents the choice between treating and not treating. Each action leads to a circular chance node representing whether disease is present (𝑝 = 0.09) or absent (𝑝 = 0.91). The terminal branches show the four possible outcomes and their assigned utilities. Rolling the tree back combines the probabilities and utilities to produce expected utilities of −0.1 for treating and 91 for not treating, making the latter the preferred action.
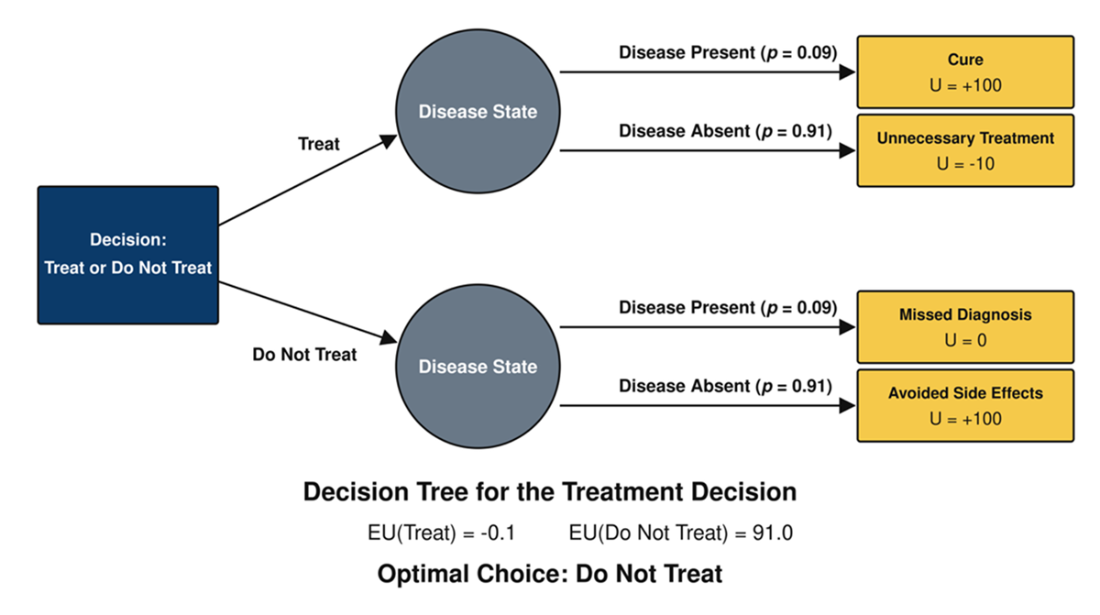
In the treatment decision, chance nodes represent whether disease is present or absent after either action; their probabilities and terminal utilities determine each action’s expected utility. section 7.1.2

