Change failure rate is the percentage of deployments that degrade production and require immediate intervention. It measures operational stability, not delivery speed. section 13.8
Read it alongside deployment frequency, lead time for changes, and time to restore service. Together, these metrics offer a diagnostic signal about how architecture performs under production pressure. section 13.8 section 13.12
Pipeline safety has a visible tradeoff:
- Automated fitness functions in commit gates can catch regressions before deployment; high failure rates point to poor system testability. section 13.8
- Skipping automated validation to ship faster means accepting higher change failure rates and longer recovery times. section 13.9.4
Making the risk explicit
When leaders want to bypass deployment checks for a deadline, the Knight Capital case can frame the risk. An Architecture Decision Record can document the choice and the risk the business accepts. section 13.9.4
Figure 13.12 The Dual Axes of DORA Metrics. High-velocity development metrics (Deployment Frequency and Lead Time) are continuously counterbalanced by operational stability metrics (Change Failure Rate and Time to Restore Service).
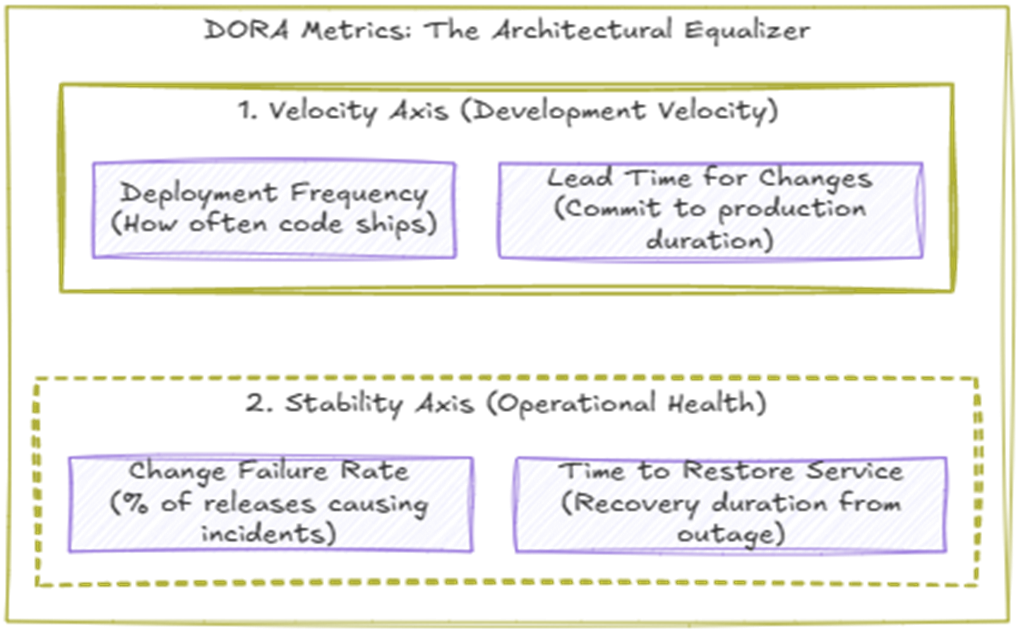
The figure places change failure rate on the stability axis opposite deployment frequency and lead time on the delivery-speed axis. section 13.8