A classification metric quantitatively evaluates how predicted categories compare with observed outcomes. For binary classification, it helps assess whether a model classifies instances correctly and supports practical decisions. section 5.2.4 section 5.0
Common measures derive from predicted and observed classes:
- A confusion matrix organizes true positives, false positives, true negatives, and false negatives. section 5.2.4
- Sensitivity, or true positive rate, measures detected positive cases; specificity, or true negative rate, measures correctly detected negative cases. section 5.2.4
- False-positive and false-negative rates quantify the two error types, while accuracy summarizes all correct predictions and misclassification rate summarizes all errors. section 5.2.4
- ROC curves plot false-positive rate against true-positive rate; AUC summarizes the curve, with 0.5 representing random guessing in the illustrated comparison. section 5.2.4
- McFadden’s pseudo R-squared compares model and intercept-only log-likelihoods to assess fit and compare models fitted to the same data. section 5.2.3
Turkish raisin classification
A logistic regression converts raisin measurements into probabilities, then assigns class 0 below 0.5 and class 1 at or above 0.5. The resulting counts are 397 true negatives, 53 false positives, 384 true positives, and 66 false negatives. These counts produce 85.33% sensitivity, 88.22% specificity, 86.78% accuracy, 13.22% misclassification, and an illustrated AUC of 0.87. section 5.2.4
Table 5.1 Confusion matrix for raisin classification. A confusion matrix stores classification metrics from a regression with actual and predicted binary outcomes.
|
Predicted
|
|||
|---|---|---|---|
|
Kecimen (0)
|
Besni (1)
|
||
|
Actual
|
Kecimen (0)
|
tn
|
fp
|
|
Besni (1)
|
fn
|
tp
|
|
Inspect the confusion matrix to connect actual and predicted binary outcomes with the four counts underlying several classification metrics. section 5.2.4
Figure 5.4 A ROC curve. The false positive rate is plotted along the x axis, and the true positive rate is plotted along the y axis. When the curve, represented by the solid line, hugs the upper-left quadrant of the plot, as it does here, it increases the area under the curve. The dashed line represents an AUC equal to 0.5, or the equivalent of random guessing.
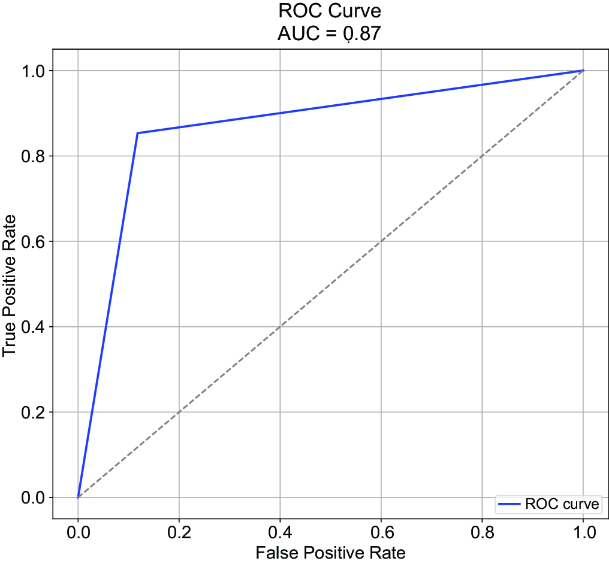
Inspect the ROC curve to see how true-positive and false-positive rates form the AUC-based performance view. section 5.2.4
