A trace ID is a shared identifier for telemetry records belonging to one request. It links the spans created as that request moves through processing steps. section 11.3 section 11.2
Without a trace ID, separate logs are difficult to connect to a request or to one another. With it, you can reconstruct the request’s sequence, follow failures across services, and investigate the input that caused an upstream error. section 11.2 section 11.3
Following a request through OpenTelemetry
A GET /books request produces spans for response processing and request details. Each span contains the same context.trace_id, such as 0x3b0367766ff238a8f6d7bdc8dc4b375b, while each has its own span ID. Searching logs for that trace ID gathers the records into one request story. section 11.3
Application code can add a custom span with OpenTelemetry’s start_as_current_span(). The span inherits the current trace context, so attributes such as user.sub and cart details remain connected to the request’s other spans. section 11.4
Figure 11.6 Adding traces to our logs allows us to correlate them and determine the original input that caused an error in an upstream service.
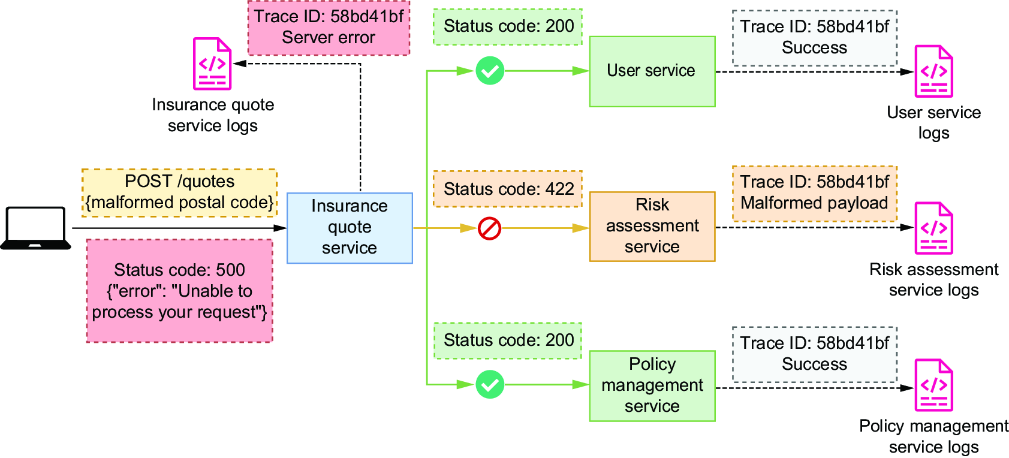
Use the figure to see how adding traces connects logs across services and reveals the original input behind an upstream error. section 11.2