Mistake #90: choosing an availability target without pricing an outage. Five nines sounds safer, but reaching it may require expensive geographically dispersed redundancy and private links that are not cost-effective for every application. section 13.2
Calculate tangible cost from lost revenue: multiply monthly sales by 12, then divide by 8,760 hours. Add harder-to-measure effects such as lost customers, morale, reputation, and regulatory exposure; a common estimate multiplies tangible cost by three. section 13.2
A $1,000-per-hour sales application
If downtime costs $1,000 per hour, compare the application’s lifecycle outage cost with the infrastructure required for each availability level rather than automatically buying the highest target. section 13.2
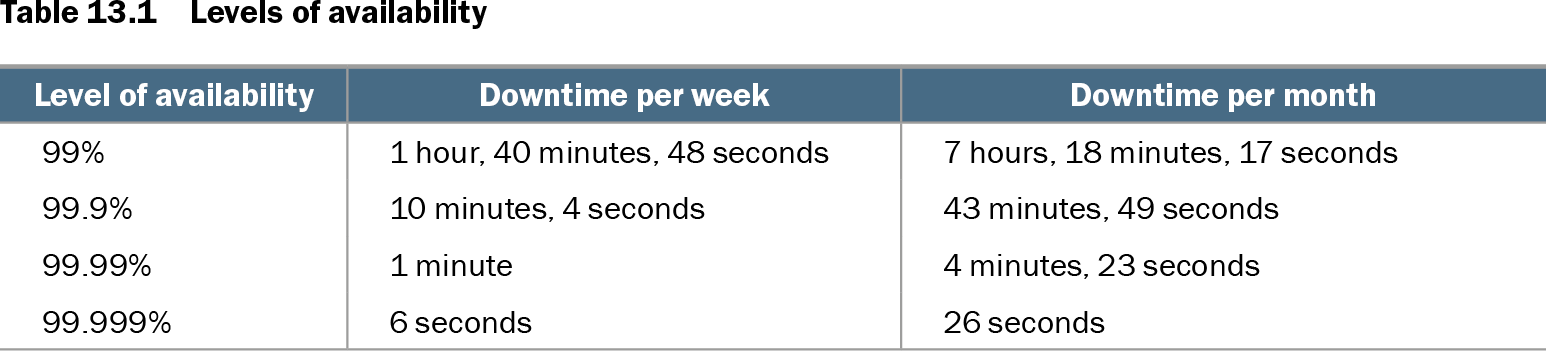
Table 13.1 Levels of availability (view table figure)
| Level of availability |
Downtime per week |
Downtime per month |
|---|---|---|
| 99% |
1 hour, 40 minutes, 48 seconds |
7 hours, 18 minutes, 17 seconds |
| 99.9% |
10 minutes, 4 seconds |
43 minutes, 49 seconds |
| 99.99% |
1 minute |
4 minutes, 23 seconds |
| 99.999% |
6 seconds |
26 seconds |
Compare availability targets with their corresponding weekly and monthly downtime. section 13.2
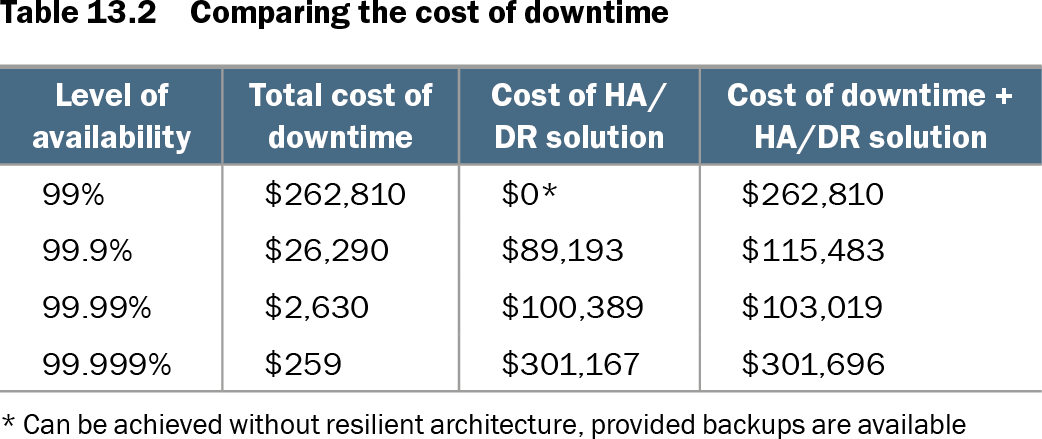
Table 13.2 Comparing the cost of downtime (view table figure)
| Level of availability |
Total cost of downtime |
Cost of HA/DR solution |
Cost of downtime + HA/DR solution |
|---|---|---|---|
| 99% |
$262,810 |
$0* |
$262,810 |
| 99.9% |
$26,290 |
$89,193 |
$115,483 |
| 99.99% |
$2,630 |
$100,389 |
$103,019 |
| 99.999% |
$259 |
$301,167 |
$301,696 |
Compare total downtime cost against high-availability and disaster-recovery investment. section 13.2